
Figures & data
Figure 1. Study locations on the northeastern coast of the North Island, Aotearoa New Zealand (A). The seven mapping locations are shown in pink and labelled. The thin grey outline is the extent of the two regional scale base maps used to estimate the extent of subtidal reef <30 m depth. An aerial photo taken at Maitai Bay showing typical zonation of dominant shallow subtidal reef habitats in the region (B), with shallow mixed forests from 0–2 m depth (C), urchin barrens from 2 to ∼10 m (D) and kelp forest from ∼10 to 15 m in this location (E), with patches of sand below.
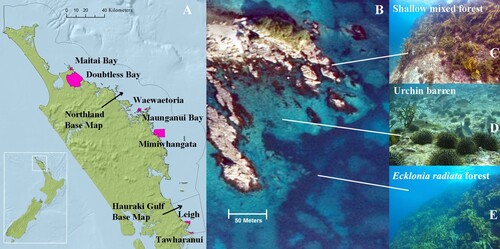
Table 1. Management status and mapping information for locations mapped in northeastern New Zealand. The maximum depth of barrens in each location was used to delineate ‘shallow’ and ‘deep’ reef areas. Aerial imagery sources: Kerr and Grace collection contact the author, Oceans 2020, National Institute of Water and Atmospheric Research 2009. Oceans 20/20 Bay of Islands aerial photo colour mosaic. NIWA GIS data. https://www.linz.govt.nz/hydro/projects-programmes/ocean-survey-2020/about-ocean-survey-2020 *A Traditional Management Rahui (full protection) has been established since mapping was completed.
Figure 2. Simplified habitat maps showing dominant reef habitat types (<30 m depth) at each of the study locations: Doubtless Bay (A), Maitai Bay (B), Waewaetoria, Bay of Islands (C), Maunganui Bay, Bay of Islands (D), Mimiwhangata (E), Leigh (F) and Tāwharanui (G). Algal turfs and C. flexuosum forest habitats were relatively rare so were combined as ‘Minor reef habitats’ for these simplified maps (see Supplementary material for higher resolution detailed maps of each location). Dashed lines indicate marine protected area (MPA) boundaries. The MPA at Mimiwhangata is partially protected, whereas at Leigh and Tāwharanui the MPA’s are no-take marine reserves. The locations of historical imagery comparisons () are outlined by black squares in (B) and (E).
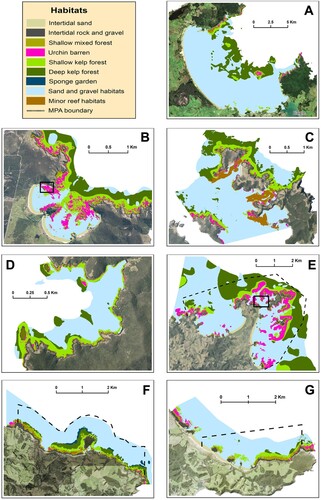
Table 2. Area of reef habitat types mapped across the seven study locations (A) and regional estimates of the extent of reef habitats (<30 m depth) on the mainland east coast of Northland, New Zealand (B). Shallow reef is defined as the area of reef within the depth limit that urchin barrens occur in each location (). The cover of urchin barrens is given for each location in (A) relative to the overall (Total) extent of reef (<30 m) and relative to the extent of shallow reef encompassing the maximum depth barrens occur. The regional extent of each habitat is estimated in two ways, based on the overall cover in mapped locations over the total reef area and when constrained to the shallow reef area. *Mimiwhangata is a marine park but allows recreational fishing.
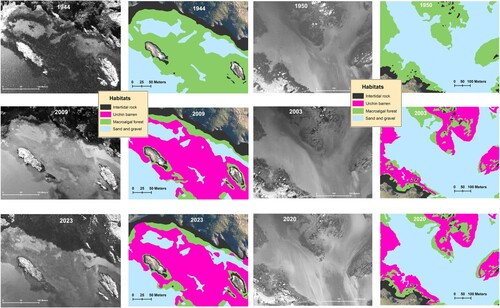
Figure 3. Historical comparison of the extent of macroalgal forest and urchin barrens on shallow reef at a study site at Maitai Bay (A) and Mimiwhangata (B). In both study sites the mapped reefs extend to a maximum depth of ∼15 m. Note: the boundaries between the different macroalgal dominated habitats could not be distinguished in the historical imagery, so are combined into ‘Macroalgal forest’ for this comparison. Original images are converted to black and white for consistency (left) and comparison with associated habitat map (right).
Northland habitats map book
Download PDF (25.1 MB)Review Notes and Explanation
Download MS Word (25.9 KB)Data availability statement
An archive of the GIS resources involved in this research have been loaded into a DRYAD archive, https://doi.org/10.5061/dryad.8gtht76w3.