Figures & data
Table 1. Links between drivers and pressures relating to Barcelona as a compact city, formulated as dynamic quantitative proxy indicators capturing evolution over time, with the rationale for a respective pressure provided in terms of effects on compact city development
Fig. 1. Research structure
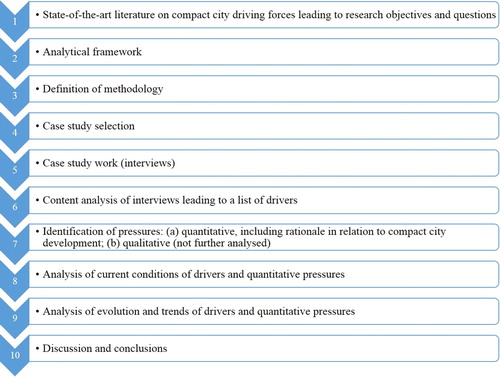
Fig. 2. The three case study districts in Barcelona and other locations (based on GIS layers from Barcelona Municipality (Ajuntament de Barcelona Citationn.d.b) and the Spanish National Centre of Geographic Information (Centro Nacional de Información Geográfica Citationn.d.)
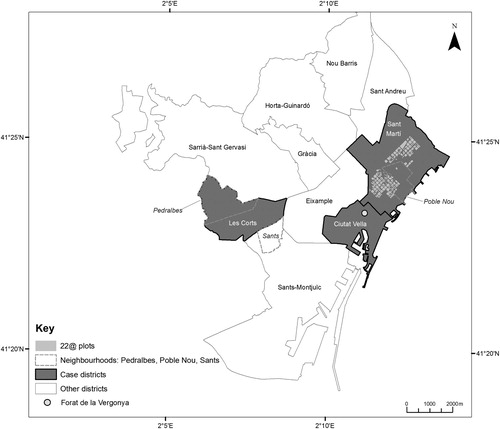
Table 2. Profiles of interviewees
Table 3. Proxy indicators as quartiles at the starting year for the three districts, including evaluation of the situation at the starting year (Q1 = low, Q2 = medium low, Q3 = medium high, Q4 = high. Evaluation: positive ++, rather positive +, rather negative -, and negative --)
Table 4. Evolution of proxy indicators expressed through quantitative proxy indicators for the three case districts in Barcelona
Table 5. Comprehensive iconographic matrix of urban indicators
Fig. 3. Initial situation of the three districts; percentages of positive, rather positive, negative, and rather negative starting points in relation to compact city development
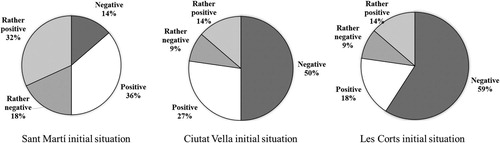
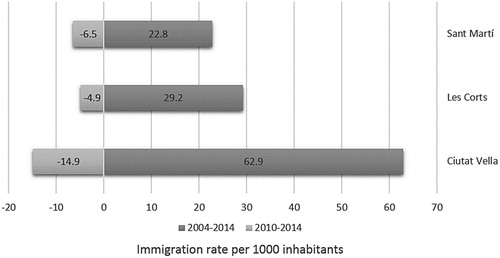
Fig. 4. Immigration rate per 1000 inhabitants; difference in a period of 5 years and in a period of 10 years (based on data accessed from Ajuntament de Barcelona Citationn.d.c)