Figures & data
Table 1. Aerial photographic interpretation and field survey by parameters most often used to define an applicable method for a given project
Fig. 1. Study area with four rectangular study sites on Hvaler Municipality, south-east Norway (Maps from Geonorge (N2000 maps and AR5 area cover), WGS 1984 UTM Zone 32N, rotation -5.1 degrees)
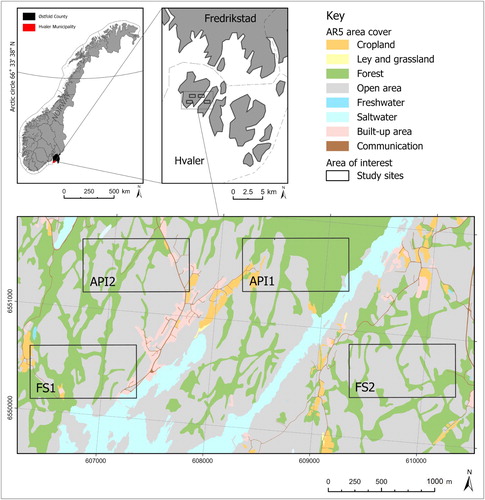
Table 2. FragStats metrics used to describe differences between the vegetation maps, and the meaning of each metric
Table 3. Criteria used for partitioning plot and map relations into three categories
Fig. 2. The ecosystem units for forest in NiN 2.0 as defined by the gradients ‘Risk of severe drought’ and ‘Basicity’; two examples of ‘different classification’ with ecological distances of two and five
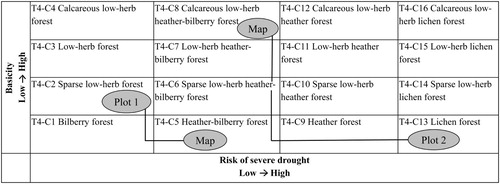
Table 4. Grouping of ecosystem units present in study areas, with ecosystem unit codes and names
Fig. 3. Ecosystem unit maps for sites API1 and FS1N; with different sites (coordinates WGS 1984 UTM Zone 32N, rotation -5.1 degrees)
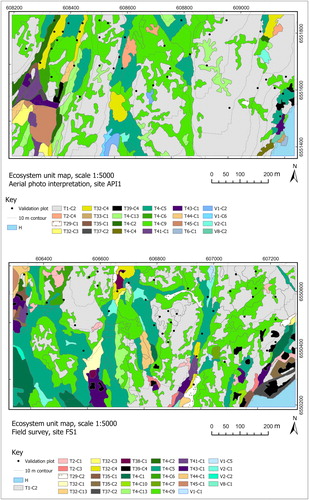
Table 5. Landscape metrics given as average results for the two aerial photographic interpretation (API) sites and the two field study (FS) sites
Table 6. Area covered by the primary ecosystem units, given for units evaluated by a minimum of one plot, including the number of plots for each ecosystem unit, the percentage accuracy in plot and map comparisons (producer’s accuracy), and the percentage accuracy of map and plot comparison (user’s accuracy)
Fig. 4. Evaluation results in three categories, with the sum of ‘Match’ and ‘Match with small delineation variation’ used as a measure for classification accuracy
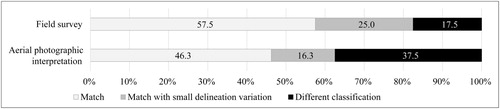
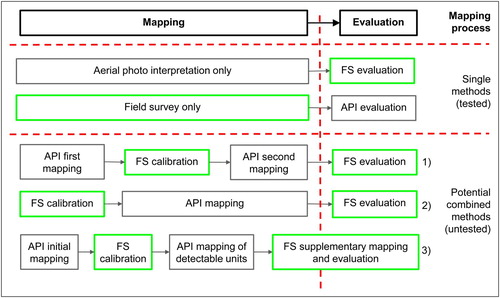
Fig. 5. The mapping process and use of aerial photographic interpretation (API) (grey boxes) and field survey (FS) (green boxes) both as single methods tested in the study and as combinations suggested by the study