
Figures & data
Table 1. List of variables used in the cluster analysis and their summary statistics
Fig. 1. The clustering process applied in the study
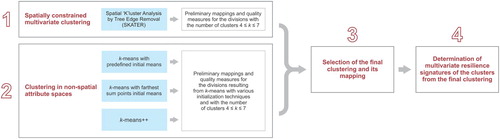
Table 2. Classification of municipalities in five computation sessions, each with multiple runs of the k-means++ clustering
Fig. 2. Evolution of the clustering process with four, five, six, and seven clusters identified through k-means clustering with three different seeding techniques: predefined initial means, farthest sum points initial means, and k-means++
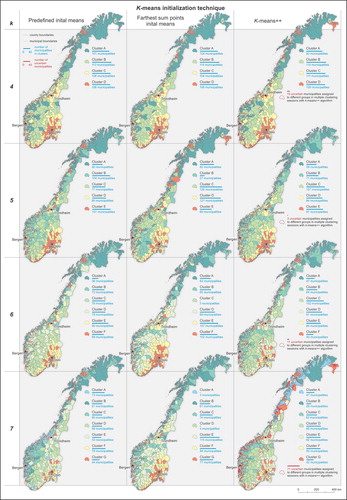
Table 3. Moran’s I indices and within-cluster sum of squares (WCSS) for the divisions obtained from k-means with predefined initial means, farthest sum points initial means, and k-means++
Fig. 3. Summary of the six groups of Norwegian municipalities resulting from the six-group k-means++ clustering
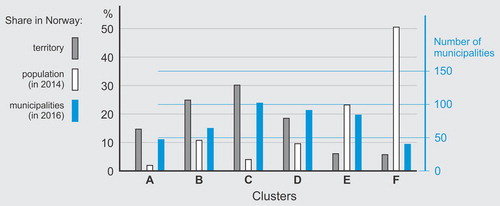
Fig. 4. Norwegian municipalities clustered on the basis of their similarities in terms of their community resilience indicators
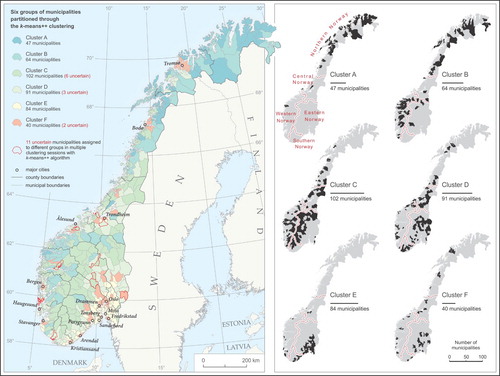
Fig. 5. Relative proportions of area resource classification by cluster
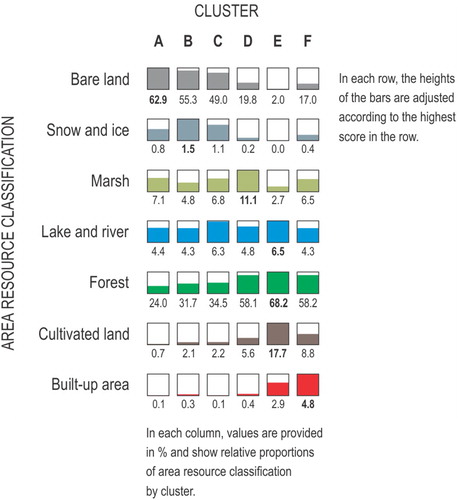
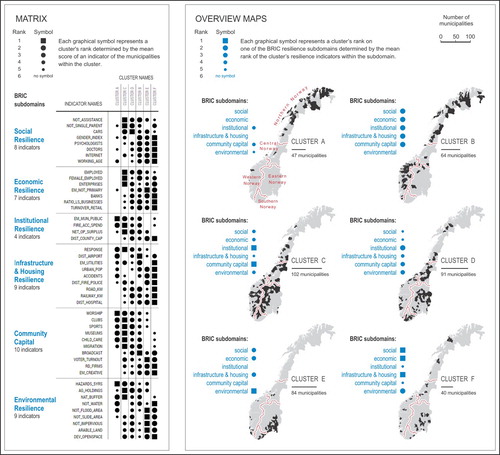
Fig. 6. The multivariate signatures of the six groups of municipalities found similar in terms of their resilience to natural hazards
Supplemental material