Figures & data
Fig. 1. Theodolite by Georg Reichenbach and Traugott Ertel in München, acquired by Hansteen in 1822 with university funding and used for the demonstration project in Christiania; the 30 cm horizontal circle is divided into 5 arcminutes and may be read using verniers to 4 arcseconds; the 19 cm vertical circle was added in 1899 (Courtesy of the Museum of the Norwegian Mapping Authority)
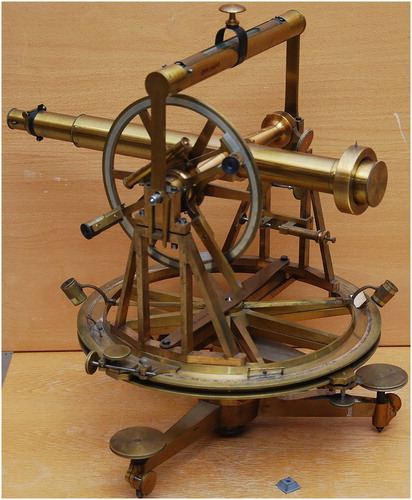
Fig. 2. Hansteen’s map of Christiania (Oslo) and environs (Omegn af Christiania) showing baselines and geodetic stations; two thick lines identify the baselines on land and on the frozen Christiania Fjord; size of original 27 × 22 cm; scale 1:25000 (Source: Hansteen Citation1824c)
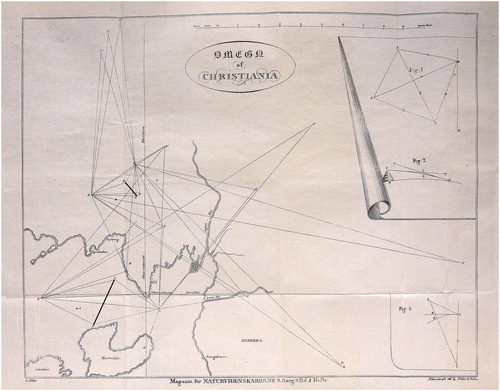
Fig. 3. Theodolite by Ertel, acquired by the Geographical Survey of Norway in 1827 for the coastal survey; the 20 cm horizontal circle is divided into 10 arcminutes and may be read using verniers to 10 arcseconds; the 16 cm vertical circle was added in 1873 (Courtesy of the Museum of the Norwegian Mapping Authority)
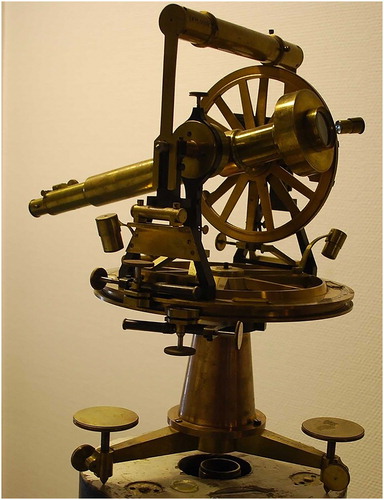
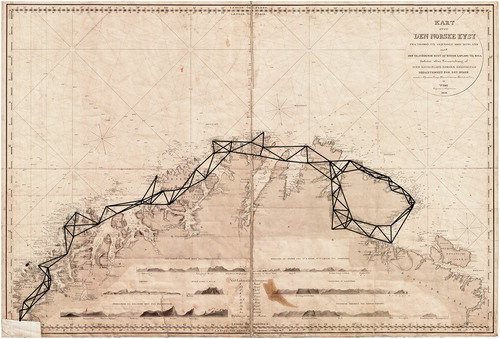
Fig. 4. The triangular arc from Trondheim to Tromsø, superimposed on a map (scale 1:750,000) constructed in 1845 from the first six coastal maps published between 1833 and 1842 (Kart over den norske kyst fra Trondhjems leden til Tromsö); the triangulation was carried out by Andreas Vibe 1828–1830, Theodor Broch 1832–1833, and Henrik Stephens Hagerup 1835; longitudes are relative to Ferro and Paris (top), and Greenwich and Christiania (bottom); size of original 70 × 89 cm (Source: https://no.wikipedia.org/wiki/Liste_over_historiske_dokumenter_hos_Statens_kartverks_sjødivisjon (accessed 20 March 2018); original with Sjødivisjonen in Statens kartverk)
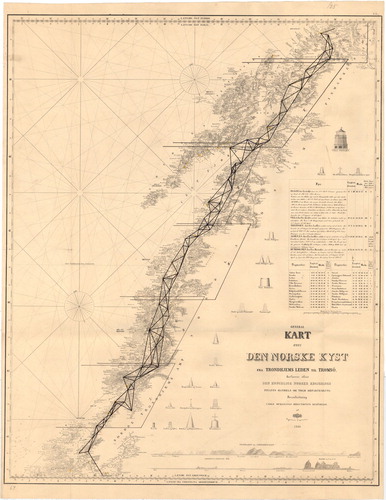
Fig. 5. The triangular arc from Tromsø to Vardø, superimposed on a manuscript map constructed in 1848 from six coastal maps published between 1841 and 1847 (Kart over den norske kyst fra Tromsö til grændsen mod Russland med den tilstödende kyst af russisk Lapland til Kola); the triangulation was carried out by Henrik Stephens Hagerup 1835–1838 and Frederik Klouman 1841; longitudes are given relative to Ferro and Paris (top), and Greenwich and Christiania (bottom); the map sheet also shows topographic profiles of the coast as seen when approaching land from the ocean; original scale not specified; size of original 92 × 62 cm (Source: https://no.wikipedia.org/wiki/Liste_over_historiske_dokumenter_hos_Statens_kartverks_sjødivisjon (accessed 20 March 2018); original with Sjødivisjonen in Statens kartverk)