
Figures & data
Table 1. School location area type, frequency and percentage
Table 2. The study variables
Fig. 1. Proportions of parents who answered that they had made an active school choice for their child (column widths proportional to number of responses)
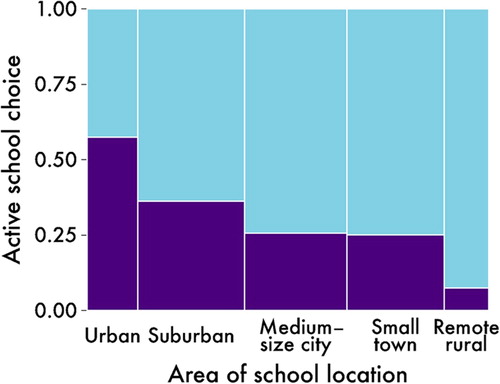
Fig. 2. Cumulative percentage for the different area types; content of active school choosers per school, ranging from lowest to highest percentage of choosers per school in the area
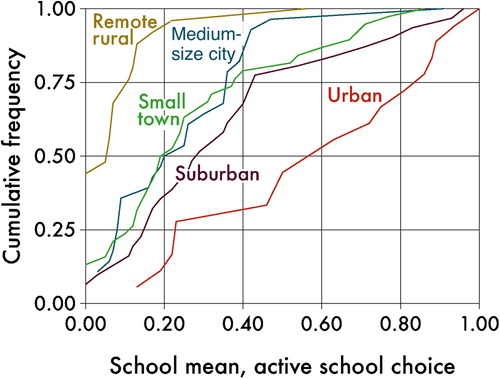
Fig. 3. The proportion of pupils with at least one parent with tertiary education (column widths proportional to number of responses)
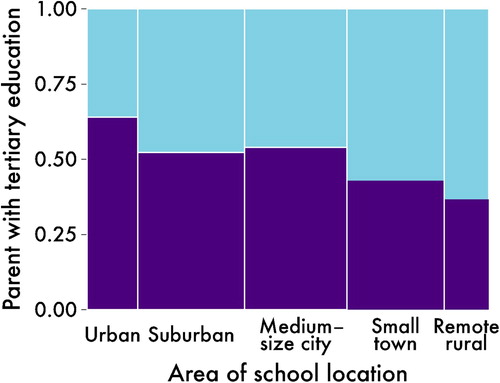
Fig. 4. The proportion of pupils without a Swedish-born parent (column widths proportional to number of responses)
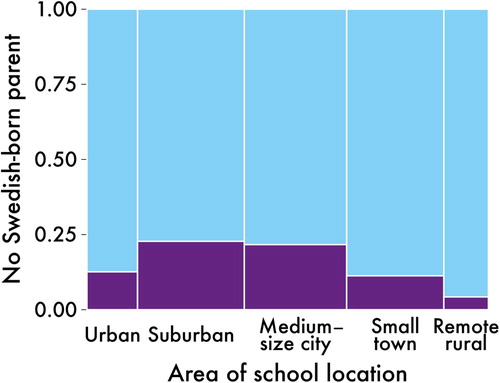
Fig. 5. The area type and the proportion of parents with higher education who made an active school choice (column widths proportional to number of responses)
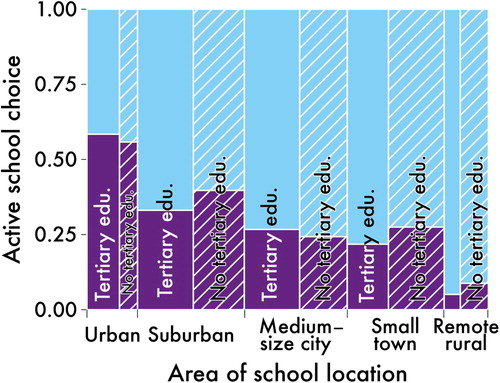
Fig. 6. The proportion of pupils who did not want to drop mathematics (column widths proportional to number of responses)
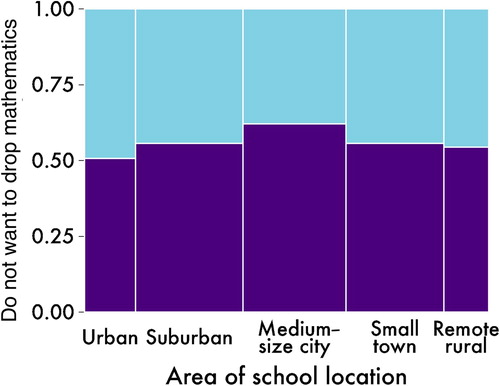
Fig. 7. The area type and the proportion of pupils who agreed strongly with the statement ‘I am proud to go to this school’ (column widths proportional to number of responses)
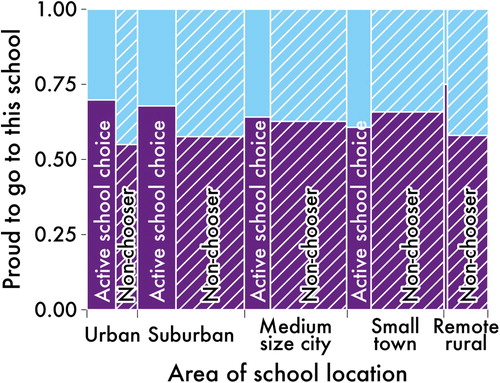
Table 3. The effects of parental status, location and class composition on maths results from the TIMMS 2015 survey (see footnote for source); fixed-effect models, with standard error shown in parenthesis (estimated using Macdonald’s Stata module (Macdonald Citation2019)); significant results (1%) shown in bold font