Figures & data
Table 1. The relationships between GPN casual drivers, modes of strategic coupling, and other key characteristics of companies (based on Coe & Yeung Citation2015; Yeung & Coe Citation2015)
Fig. 1. Number of employees and structure of the Czech electro-engineering companies according to ownership and tier in 2018 (based on data accessed from Merk.cz’s online database in July 2020)
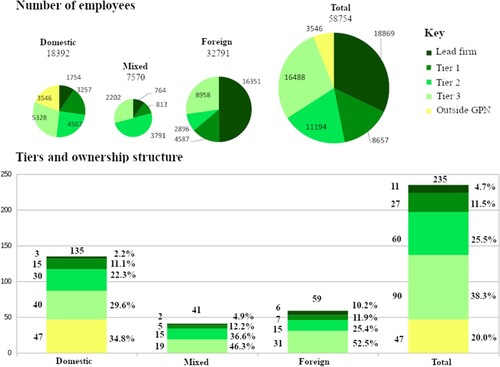
Table 2. Typology of electrical engineering components used for classification of suppliers into tiers
Fig. 2. Regional distribution of the Czech electro-engineering companies in 2018 (based on data accessed from Merk.cz’s online database in July 2020)
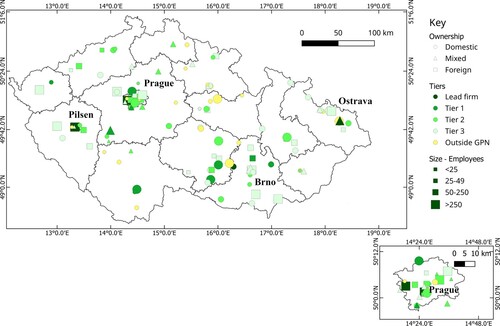
Table 3. The key absolute economic performance indicators according to firms’ ownership and position in the global production networks (GPNs) – mean and median values for the period 2012–2018 (thousand USD) (Source: data accessed from Merk.cz’s online database in July 2020)
Table 4. The key relative economic performance indicators according to firms’ ownership and position in the global production networks (GPNs) – mean and median values for the period 2012–2018 (thousand USD) (Source: data accessed from Merk.cz’s online database in July 2020)
Table 5. The relationships between economic performance indicators and ownership, tier, and size, tested by Kruskal-Wallis tests (N = 127 (Source: data accessed from Merk.cz’s online database in July 2018)
Table 6. Correlation analysis of the relationships between the firms’ characteristics and their economic performance for the period 2012–2018 (N = 127)
Fig. 5. Relationship between profit-turnover ratio and wages per employee for the period 2012–2018 based on data accessed from Merk.cz’s online database in July 2020)
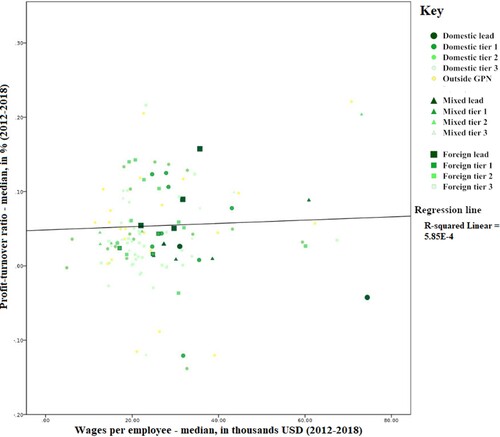
Fig. 3. Regional distribution of firms’ profit-turnover ratio, median values for the period 2012–2018 (in %) (based on data accessed from Merk.cz’s online database in July 2020)
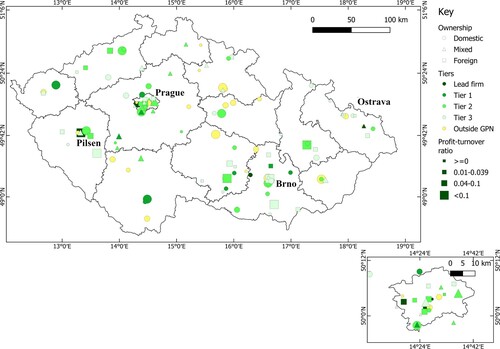
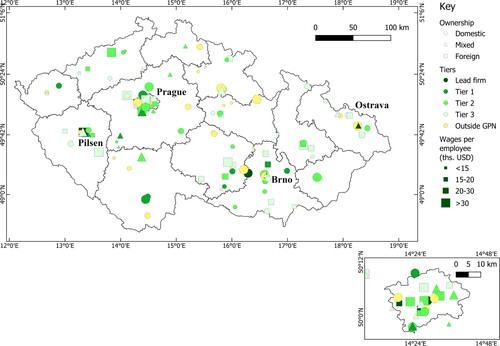
Fig. 4. Regional distribution of firms’ wages per employee, median values for the period 2012–2018 (thousand USD) (based on data accessed from Merk.cz’s online database in July 2020)