
Figures & data
Fig. 1. Example images representing the different image attributes (Photos: Wenche Dramstad, NIBIO, upper row from left to right 2021, 2018, 2021, lower row from left to right 2017, 2018, 2019)
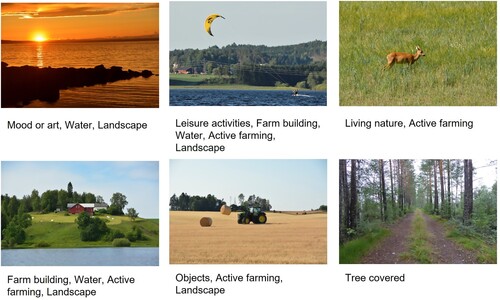
Fig. 2. A photo example illustrating identification of attributes in an example image (Photo: Wenche Dramstad, NIBIO, 2014)
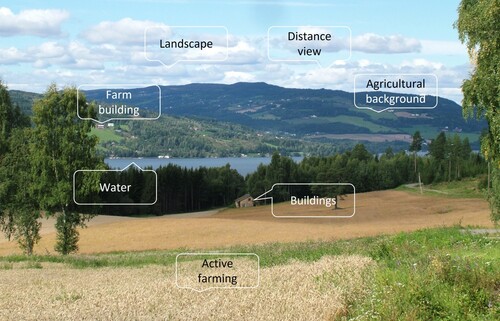
Table 1. Predefined image attributes identified during inspection of the photos
Fig. 3. Example of tag categories and aggregation of tags in the data illustrated on an example photo (Photo: Wenche Dramstad, NIBIO, 2010)
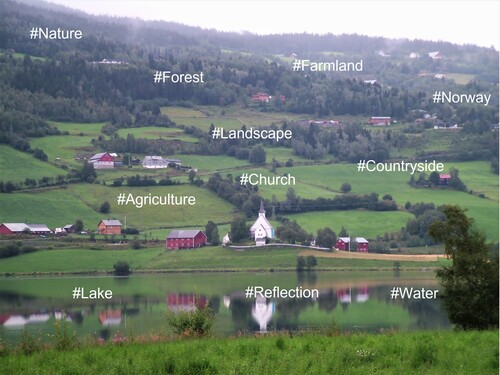
Fig. 4. Number of photographs taken within Norway and uploaded to Flickr between 2016 and 2020 (total 16,499)
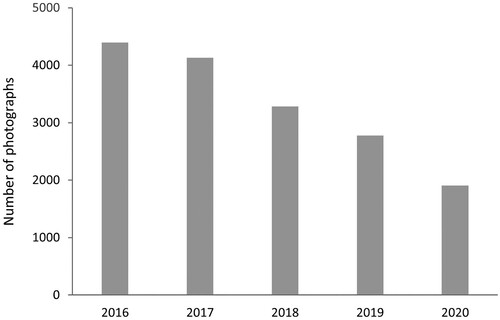
Fig. 5. Location of the 11,575 unique photo points (left-hand side) and top 10 photo locations, based on kernel density with a 50,000 m search radius and 5000 m cell size (right-hand side)
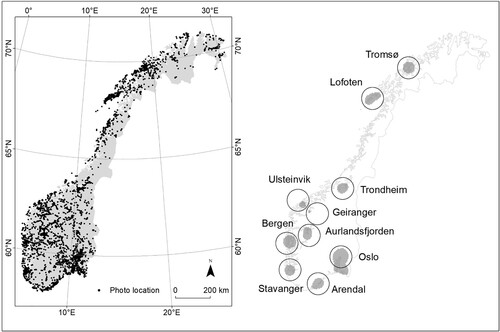
Fig. 6. a) Proportion of photos and area per land cover type in Norway; b) Photos per km2 for the different land cover types in Norway (photos apparently taken at sea are excluded from both graphs)
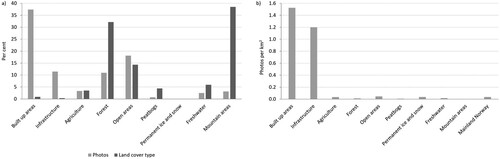
Fig. 7. Photos taken in the different land cover types (categories): (a) agriculture, (b) forest, (c) mountains, and (d) water
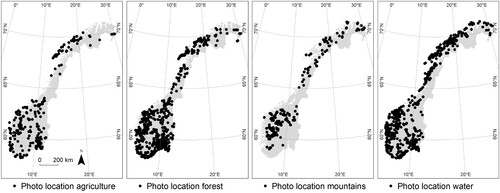
Table 2. Distribution of tags within each group of photos (%)
Table 3. Numbers of photos with hashtags and unique tags for each group