
Figures & data
Fig. 1. The SURE-Farm framework for resilience assessment
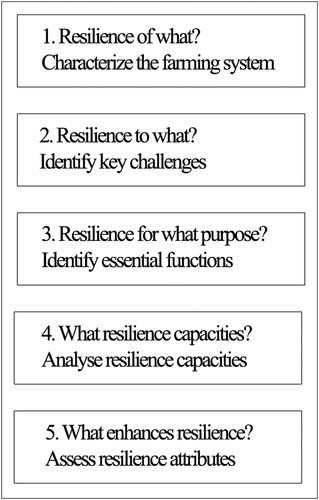
Fig. 2. Farm size at county level in Norway in 2017 (Statistics Norway Citationn.d.,e)
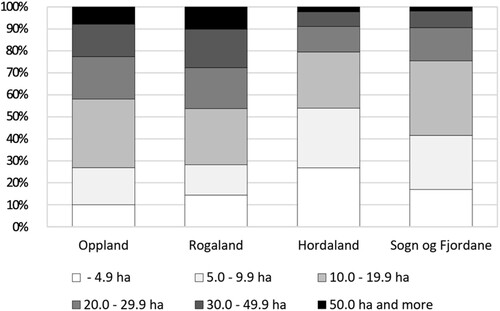
Fig. 3. Change in agricultural land (Statistics Norway Citationn.d.,d) and change in the number of farms (Statistics Norway Citationn.d.,c) in four counties in Norway between 2007 and 2017
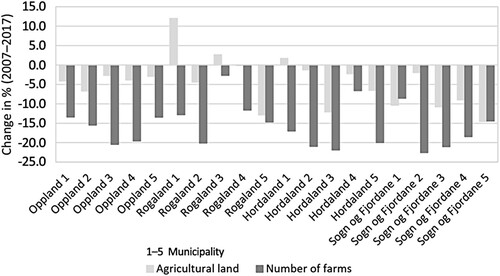
Fig. 4. Changes in types of livestock production at county level from 1998 to 2017; data for poultry unavailable for several years for Sogn og Fjordane (Statistics Norway Citationn.d.,h)
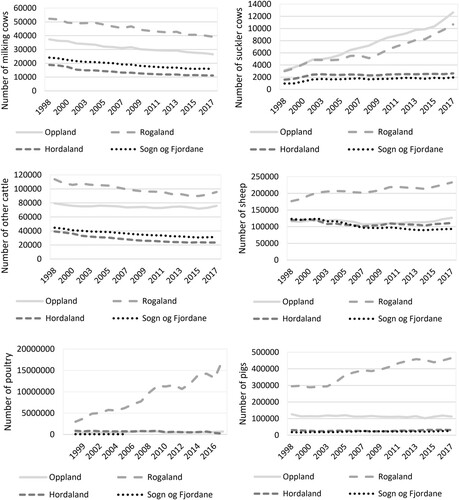
Fig. 5. Changes in production of cereals, fruit (including berries), and vegetables (including potatoes) between 1999 and 2017 (Statistics Norway Citationn.d.,g)
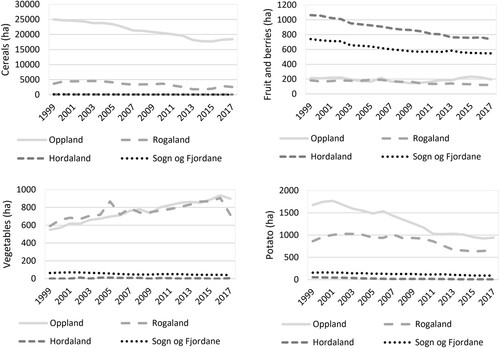
Table 1. Resilience attributes in 2018 (when interviews were held), and in SSP1 Sustainability and SSP5 Fossil-fueled development