
Figures & data
Fig. 1. Study area and selected tourism regions
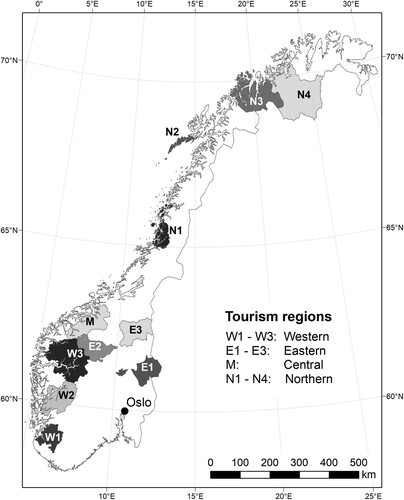
Table 1. Model combinations retrieved from the high-resolution Euro-CORDEX data set
Table 2. Average annual and seasonal precipitation as rain, sleet and snow, and number of days with precipitation as rain, sleet and snow in Norway during the period 1971–2000, based on the ensemble-mean of 10 bias-adjusted series in the COR-BA dataset, with percentage of total precipitation and number of days with precipitation in the different phases given for the COR-BA dataset and the observation based reference dataset
Fig. 2. Average number of days per year with (a) rain, (b) sleet and (c) snow during the period 1971–2000, according to the COR-BA dataset
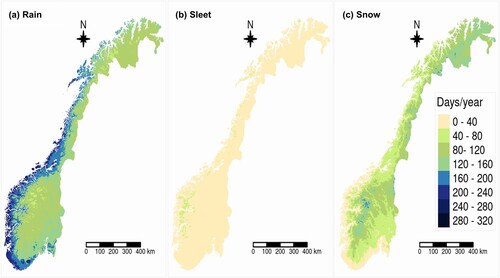
Table 3. Average values (mm) of the annual and seasonal amounts of rain, sleet, snow, and total precipitation in Norway during the reference period 1971–2000 and for the two scenario periods 2031–2060 and 2071–2100 under RCP4.5 and RCP8.5, with all values as ensemble medians based on the COR-BA dataset, and change from reference period (in %) given for the scenarios
Fig. 3. Change (% of 1971–2000 average) in annual precipitation sums as (a) rain, (b) sleet and (c) snow from the period 1971–2000 to the period 2071–2100 under RCP4.5, according to the COR-BA dataset
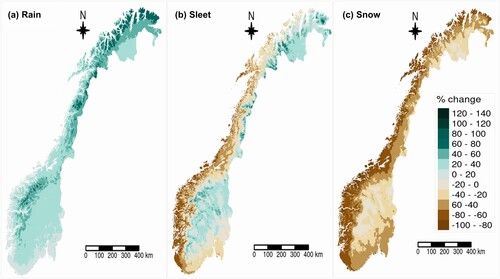
Table 4. Average number of days per year or season with rain, sleet, snow, and total precipitation in Norway during the reference period 1971–2000 and for the two scenario periods 2031–2060 and 2071–2100 under RCP4.5 and RCP8.5, with all values as ensemble medians based on the COR-BA dataset
Fig. 4. Change in average annual number of days with precipitation as (a) rain, (b) sleet and (c) snow from the period 1971–2000 to the period 2071–2100 under RCP4.5, according to the COR-BA dataset
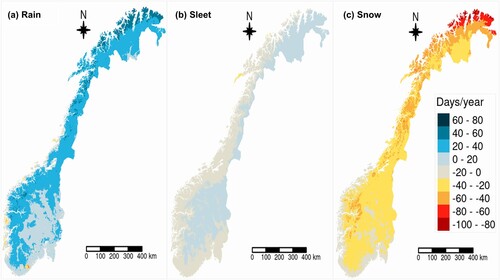
Fig. 5. Distribution in tourism region W3 of rain, sleet, and snow for different altitude intervals in winter (December, January, February) and spring (March, April, May) in the reference period 1971–2000 (left-hand panels), and projections for the period 2031–2060 (right-hand panels) under RCP4.5, according to the COR-BA dataset
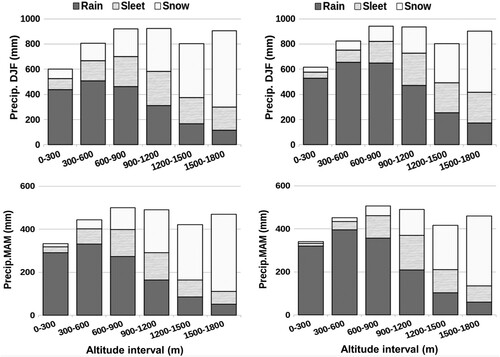
Fig. 6. Distribution in tourist region E3 of rain, sleet, and snow for different altitude intervals in winter (December, January, February) and spring (March, April, May) in the reference period 1971–2000 (left-hand panels), and projections for the period 2031–2060 (right-hand panels) under RCP4.5, according to the COR-BA dataset
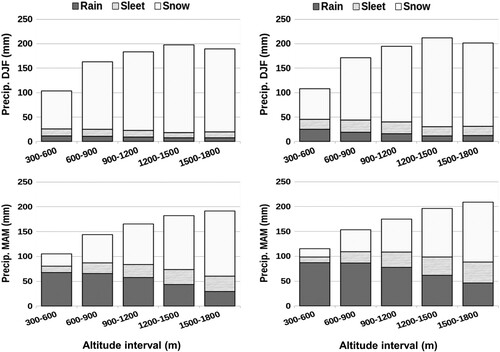
Fig. 7. Distribution in tourism region N4 of rain, sleet, and snow for different altitude intervals in winter (December, January, February) and spring (March, April, May) in the reference period 1971–2000 (left-hand panels), and projections for the period 2031–2060 (right-hand panels) under RCP4.5, according to the COR-BA dataset
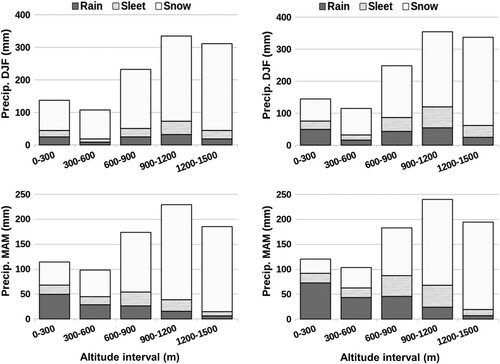
Fig. 8. Annual number of days with precipitation as of rain, sleet, and snow for different altitude intervals in winter (December, January, February) and spring (March, April, May) in the reference period 1971–2000 (left-hand panels), and projected changes to the period 2031–2060 (right-hand panels) under RCP4.5, according to the COR-BA dataset, for tourism regions W3 (panel/row a), E3 (panel/row b), and N4 (panel/row c)
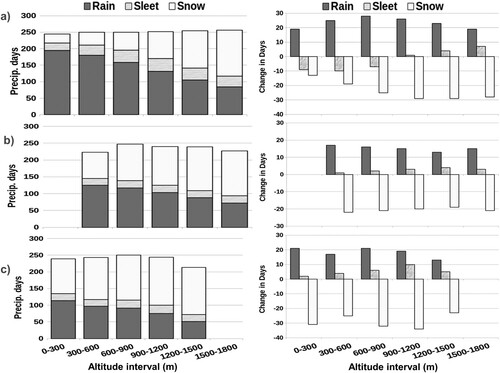
Table 5. Distribution of rain, sleet, and snow in winter (December, January, February) during the reference period 1971–2000 and for the projections for the period 2031–2060 under RCP4.5
Table 6. Distribution of rain, sleet and snow in spring (March, April, May) during the reference period 1971–2000 and for the projections for the period 2031–2060 under RCP4.5, with values given for the 11 tourist regions shown in , and in each region for different 300 m a.s.l. altitude intervals