Figures & data
Fig. 1. Illustration of concentration profile in the water in a vertical slot in contact with the buffer with concentration co at its surface, indicated by the solid arrow to the left.
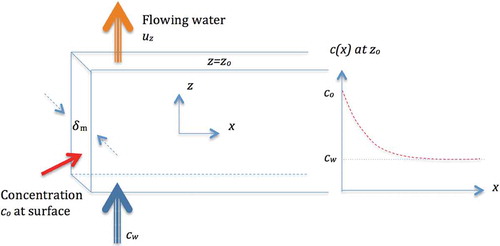
Fig. 2. as a function of fracture transmissivity for two different hydraulic gradients.
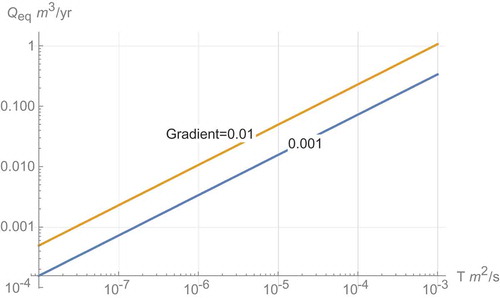
Fig. 3. (a) Velocity and (b) penetration depth as a function of transmissivity for cubic law fractures.
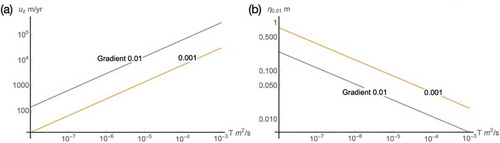
Fig. 4. Fracture aperture versus transmissivity T.
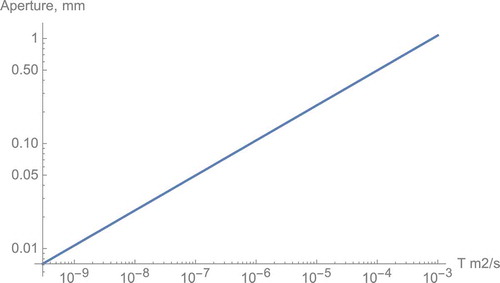
Fig. 5. The flowing stream with low concentration takes up salt from water in the fracture and from the surrounding porous rock matrix with higher salt concentration.
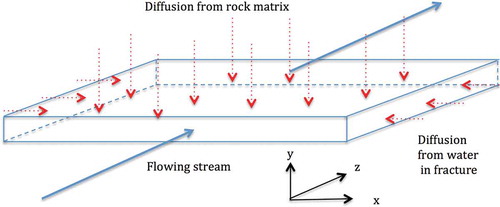
Fig. 6. Plots of the concentration evolution 200 m above the source based on Eq. (20) for three combinations of transmissivity and density-induced gradient.
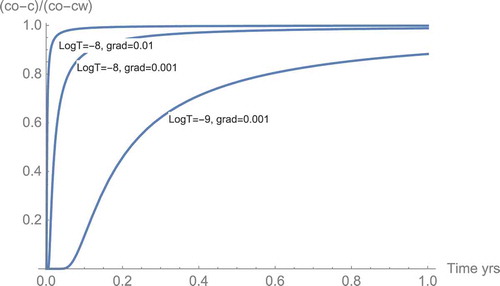
TABLE I Equivalent Flow Rates from Analytical Solution and Numerical Calculations Using Dw = 10−9 m2/s, = 0.001 Pa s, and
, Height zo = 20 m
Fig. 7. The flow field and concentration profile in a 220-m-high fracture with a 20-m-high source in the lower left corner for T = 10−8 and a density difference of (a) 0.001 and (b)
0.01. The color code shows the relative concentration difference.
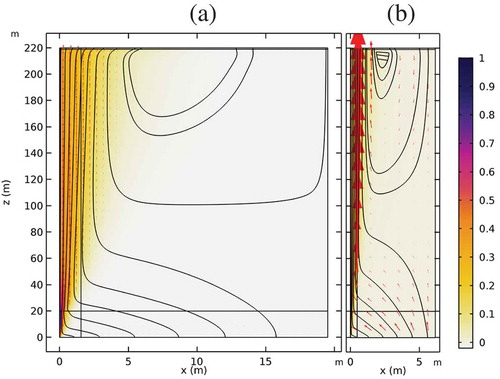
Fig. 8. Enlargement of the left corner of showing the flow field and concentration profile near the 20-m-high source on the left side for T = 10−8 and a density difference of 0.001.
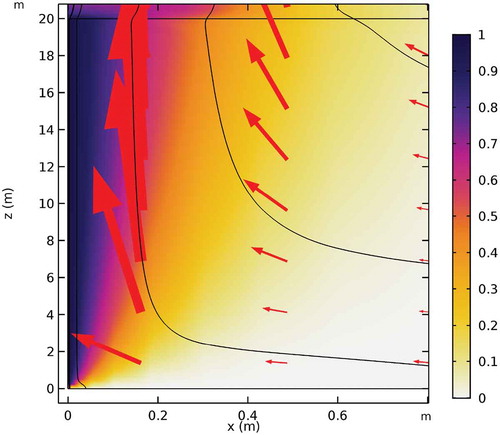
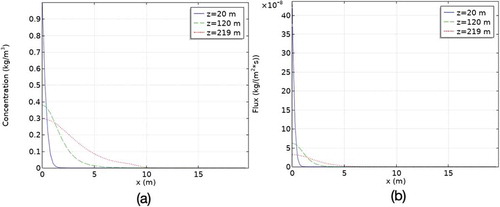
Fig. 9. (a) Concentration and (b) flux profiles at steady state at z = 20-, 120-, and 219-m height.