
Figures & data
Fig. 1. Heat flux focusing effect at vessel in the upper metallic layer.
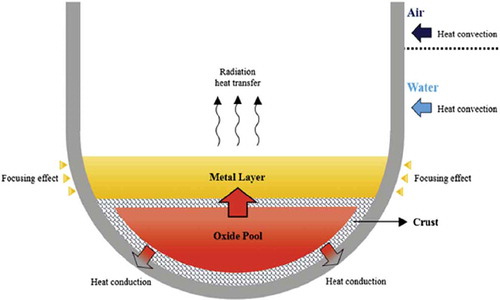
Fig. 2. LIVE2D test vessel during the two-layer test. The upper layer thickness is 75 mm.
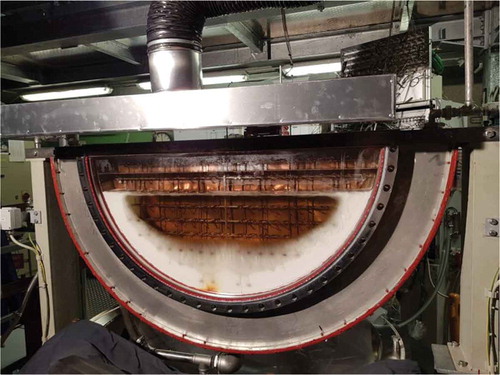
TABLE I Thermal-Physical Properties of Simulant and Prototypical Materials
TABLE II Thermocouple Positions at IT and the Upper Layer Positions
Fig. 3. Temperature measurement inside and on the test vessel.
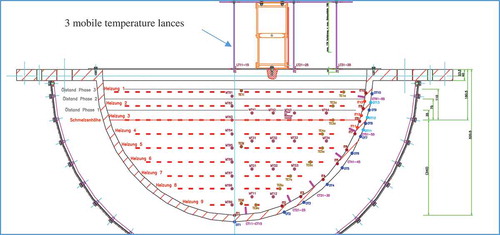
TABLE III Test Procedures
Fig. 4. Melt temperature progression in lower and upper layers at radius of 1 cm. The height reference is the layer interface at 340 mm.
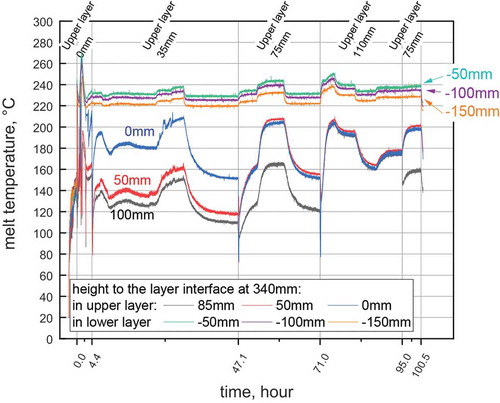
Fig. 5. Vertical temperature profiles at three radii in the upper layer. There is no complete interface crust during the power level.
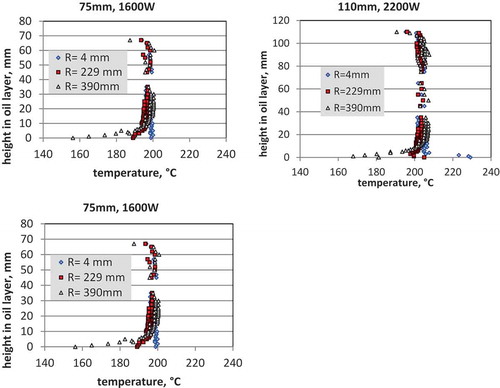
Fig. 6. Radical MTs at (a) the layer interface and (b) at 390-mm height. (* indicates there is no complete interface crust during the power level.)
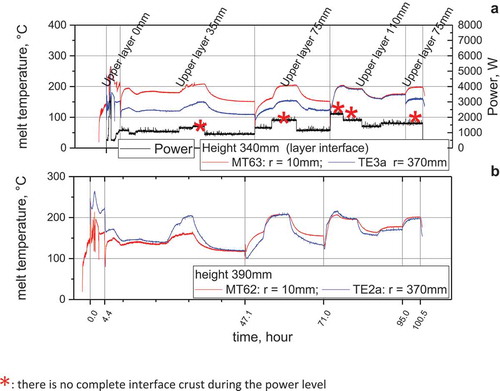
Fig. 7. Two-layer melt pool: (a) the interlayer crust is partially melted down in the central region, and (b) a new interlayer crust formed after power reduction which was slightly lower than the former one.
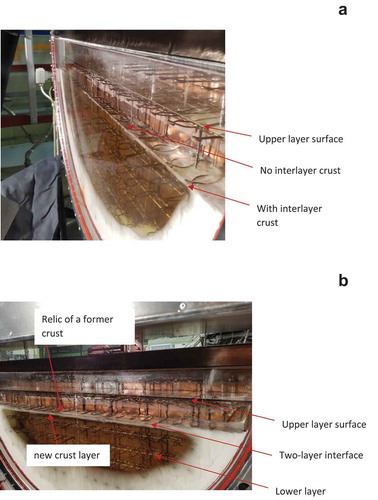
Fig. 8. Wall inner surface temperature in the upper layer and lower layer.
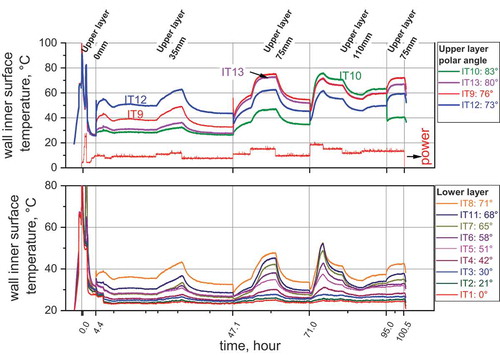
Fig. 9. Heat fluxes at different height positions of the vessel wall in three upper layer thicknesses.
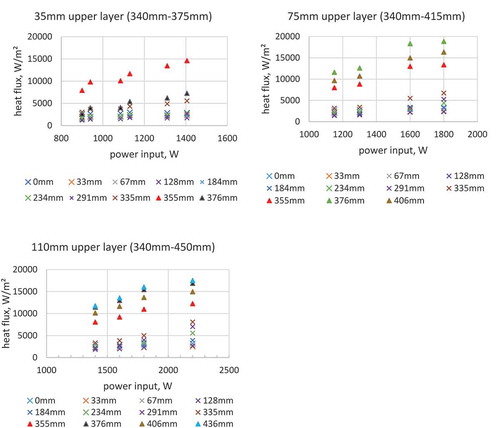
TABLE IV Upper Wall/Lower Wall Heat Transfer Ratio and Heat Loss Ratio