Figures & data
TABLE I Fuel Rod Design Parameters, Including Geometry, Fuel Pellet, and Cladding Data
TABLE II BR3 Core Data
Fig. 1. (a) Evolution of the LHGR during the three reactor cycles and (b) Power/flux profile at the beginning, middle, and end of a reactor cycle.
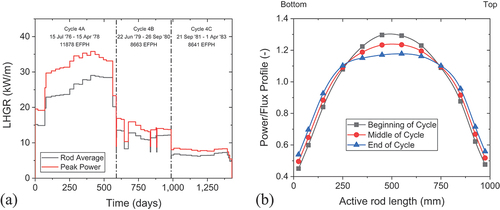
Fig. 2. (a) Evolution of the burnup during the three reactor cycles and (b) Burnup profile at the end of cycles 4A, 4B, and 4C.
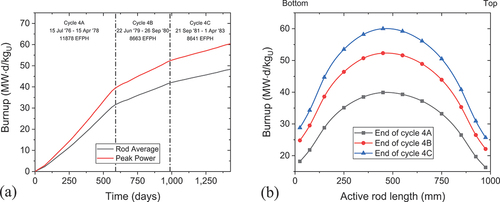
Fig. 3. (a) Average creep down and ovality along the active rod length after base irradiation and (b) Changes in the rod geometry after base irradiation.
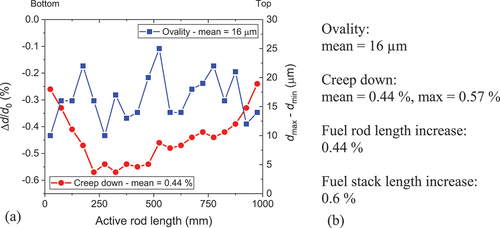
Fig. 4. (a) Comparison of the 137Cs activity profile with the calculated burnup. For completeness, the fast fluence (>1 MeV) profiles are added to the plot. (b) Comparison between the experimentally determined and calculated burnup and fast fluence.
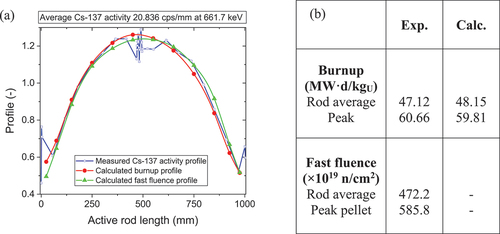
TABLE III Fission Gas Release Data Measured in the Sibling Rod
Fig. 5. Schematic drawing of PWC and CD used in the ramp test. The dimensions are in millimeters from the core mid-plane.
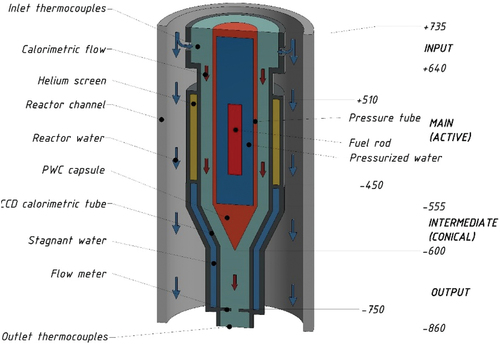
Fig. 6. (a) Detailed evolution of the peak LHGR during the startup, preconditioning, and power ramp and (b) Power profile during the ramp test.
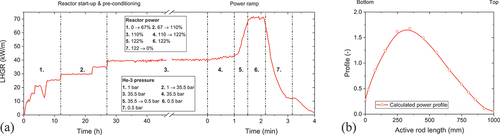
Fig. 7. (a) Neutron radiographs of the same section. The cutting scheme based on the nondestructive analysis is indicated on the fuel rod and (b) Locations of the damaged rod sections enriched with images of the cracks.
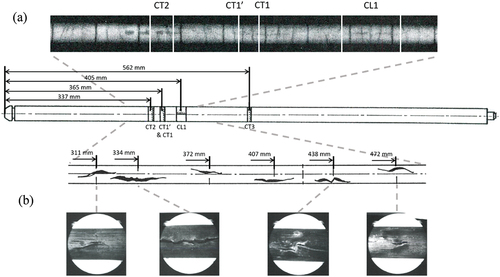
Fig. 8. Cladding outer diameter along the rod length from profilometry measurements. The molten zone, failed zone, and cut sections are indicated in the plot.
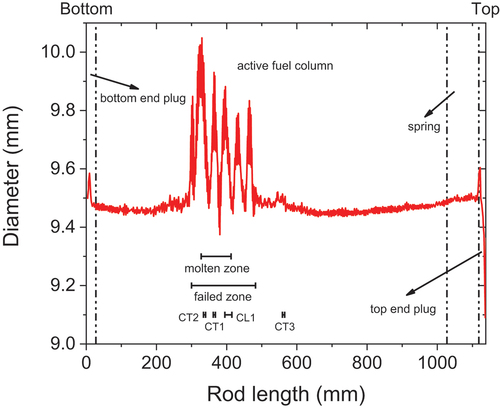
Fig. 9. Axial 137Cs profiles after base irradiation and the power ramp. The molten and failed zones are indicated in the plot.
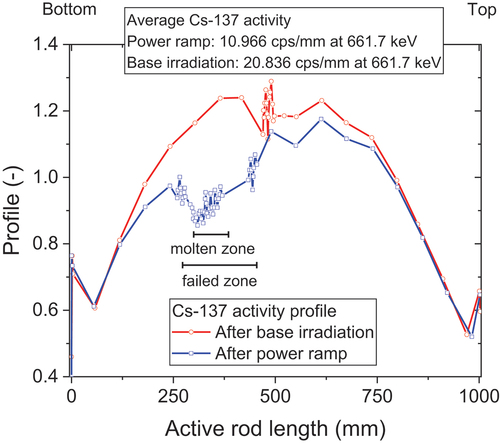
Fig. 10. (a) Comparison between 95Zr/95Nb activity profile and the power profile calculated from thermal neutron flux in the reactor channel. The molten and failed zones are indicated in the plot. (b) Comparison between the peak power and shape factor obtained by both methods.
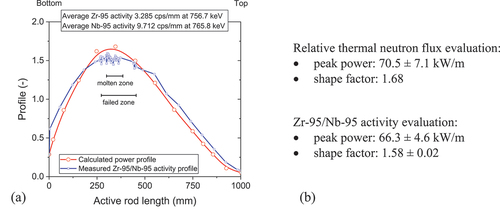
TABLE IV Sample Details for Destructive Analyses, Where the Reported Ramp Terminal Level Was Obtained from the 95Zr/95Nb Activity Profiles
Fig. 11. Macrographs and alpha- and beta-gamma autoradiographs of the cross-sections CT1, CT2, CT3, and CL1. The molten fuel zone is indicated by red dashed lines. The zones in green show the pellet-pellet interface.
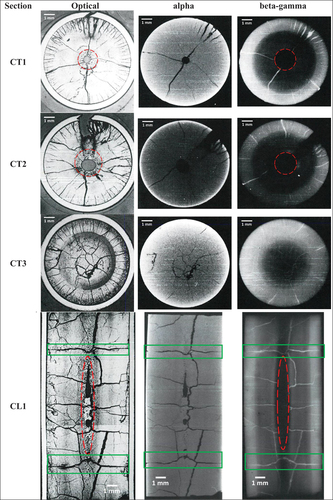
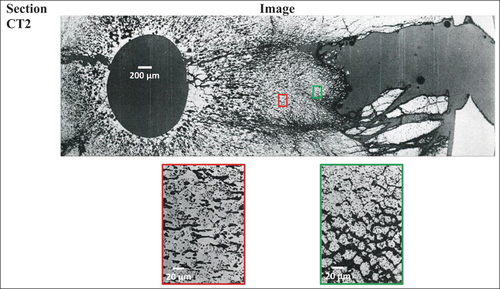
Fig. 12. Images of the transversal sections CT1, CT1’, and CT2 where molten zones were observed. The molten zone is encircled with red dashed lines. The blue dash-dotted line indicates the boundary between the fuel at the periphery with the original microstructure and the highly restructured fuel due to fission gas release. All images were taken as polished, except for the zoom-ins, which were taken from etched samples.
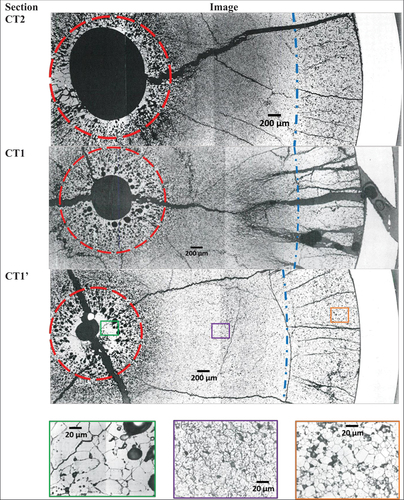
Fig. 13. Image of the longitudinal section CL1 and zoom-in of the molten zone. The molten zone is indicated in by a red dashed line. The zones in green show the pellet-pellet interface.
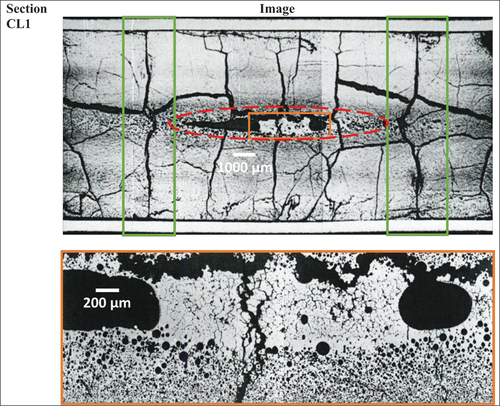
Fig. 14. Images of the transversal section CT3 where no melt was observed. The central region is encircled by the dashed line. The blue dash-dotted line indicates the boundary between the fuel at the periphery with the original microstructure and the highly restructured fuel due to fission gas release. All images were taken as polished, except for the zoom-ins, which were taken from etched samples.
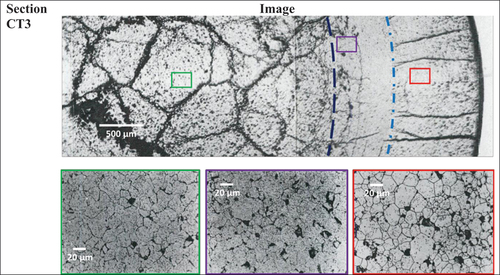
TABLE V Isotopic Analyses of the 20-cm3 PWC Water Samples Taken at Different Locations and Moments of the Experiment
Fig. 15. Image of the transversal section CT1 showing incipient cracks next to the cladding failure. The zoom-in shows three radial incipient cracks.
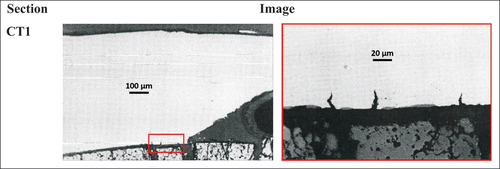
Fig. 16. Images of the transversal section CT2 near the failed cladding. The zoom-ins show extremely swelled fuel that could correspond to once molten fuel.