Figures & data
Fig. 1. Free-body diagram of a pinned-pinned cylinder.
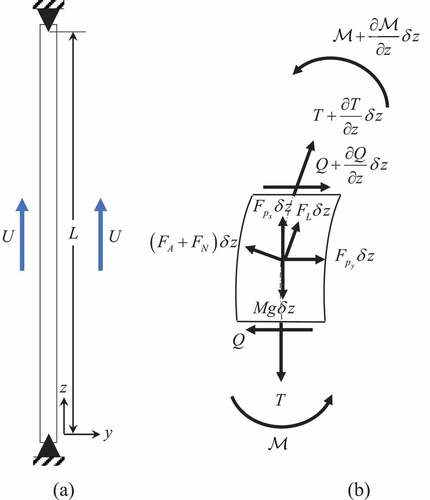
Fig. 2. Wire-wrapped pin and bundle geometry.
Fig. 3. Elliptical cross-sectional area of a helically wrapped wire spacer.
Fig. 4. Wire added cross-sectional area as a function of P/D and H/D.
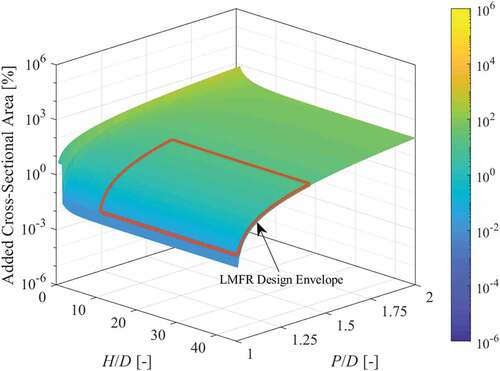
Fig. 5. Wire added area moment of inertia as a function of P/D and H/D.
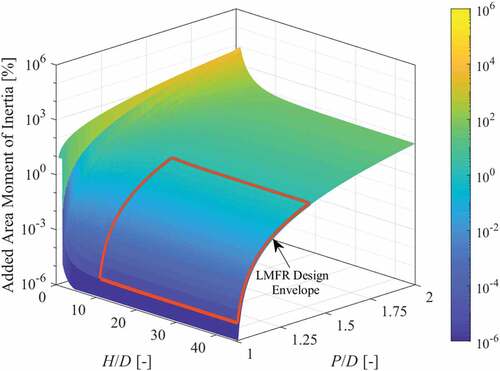
Fig. 6. Square channel cross-section geometry.
Fig. 7. Wire added friction factor as a function of P/D and H/D.
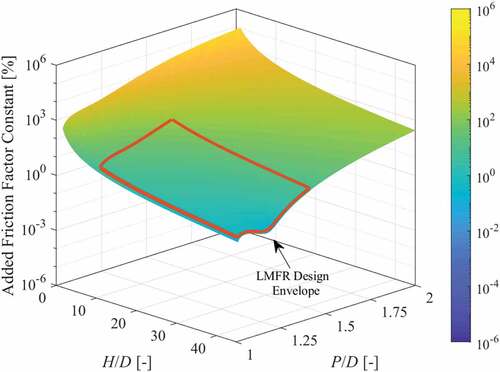
TABLE I Beam Dimensionless Frequency and Mode Shape Parameters*
Fig. 8. Argand diagram for a bare pinned-pinned cylinder.
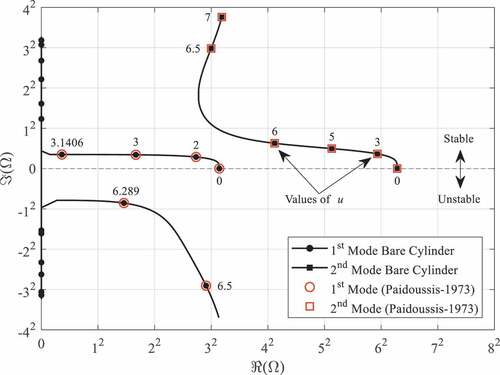
TABLE II Galerkin Approximation Convergence of Critical Dimensionless Velocities
Fig. 9. Argand diagram for bare (a) fixed-fixed, (b) fixed-free, and (c) pinned-pinned cylinders.
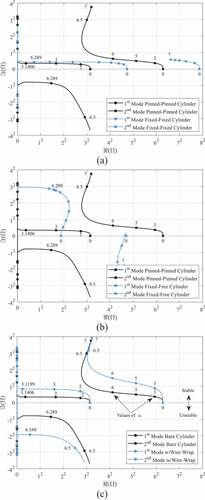
Fig. 10. Single-pin flow test schematic.
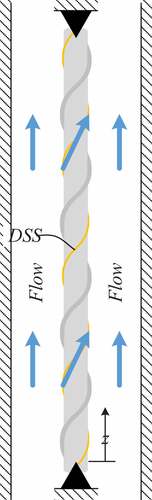
Fig. 11. Single-pin flow test experimental setup.
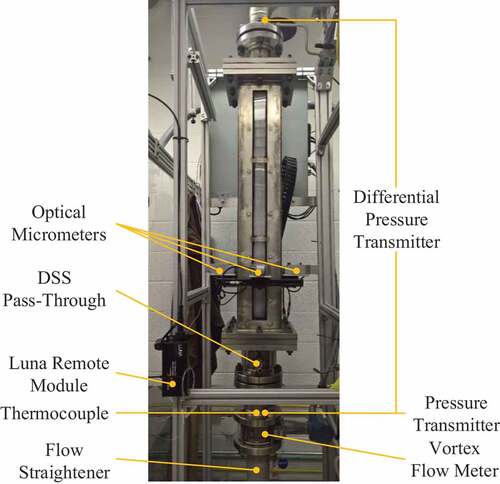
TABLE III Test Pin Dimensionless Parameters
Fig. 12. Test pins 1 through 5 (from left to right) on a pin rail.
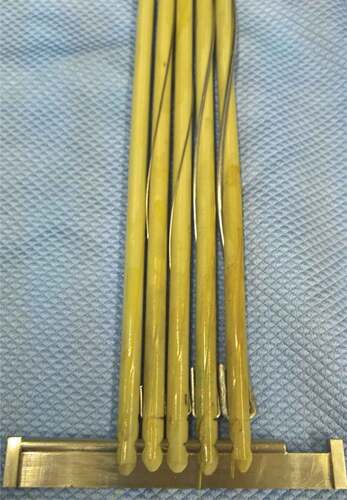
TABLE IV Test Pin Geometric Specifications
TABLE V Test Pin Material Specifications
TABLE VI Effect of Wire on Test Pin Parameters
Fig. 13. Argand diagram of TP-1 (bare cylinder).
Fig. 14. Argand diagram comparison of bare and wire-wrapped cylinders.
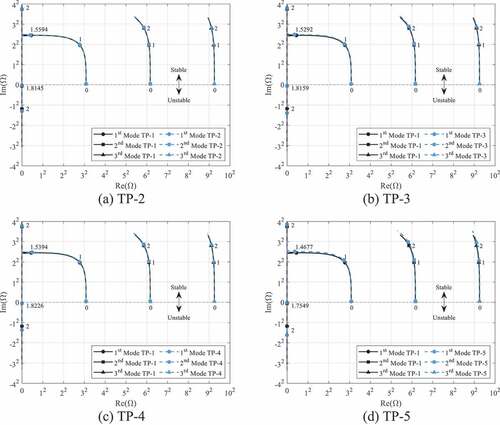
Fig. 15. Experimental flow test schematic.
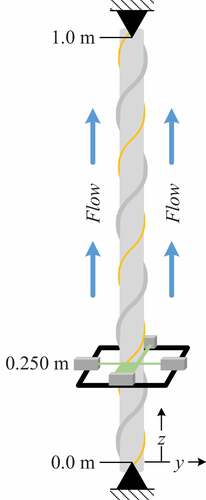
Fig. 16. (a) Reynolds number and (b) pressure drop as a function of flow rate into the test section.
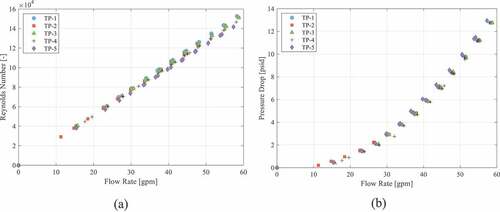
Fig. 17. Test pin RMS vibration amplitudes in (a) x-direction and (b) y-direction.
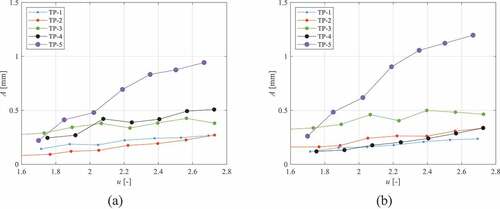
Fig. 18. Optical micrometer frequency results for (a) TP-1 and (b) TP-2; modal frequencies for (c) TP-1 and (d) TP-2.
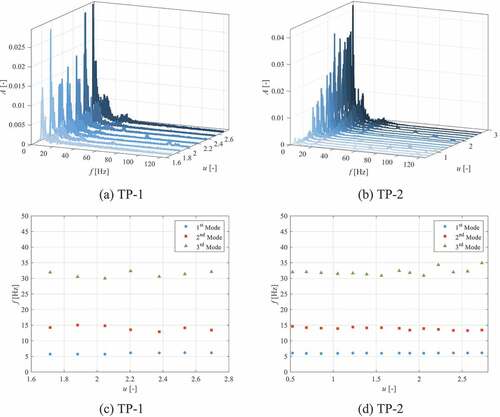
Fig. 19. Optical micrometer frequency results for (a) TP-3, (b) TP-4, and (c) TP-5; DSS frequency results for (d) TP-3, (e) TP-4, and (f) TP-5; modal frequencies for (g) TP-3, (h) TP-4, and (i) TP-5.
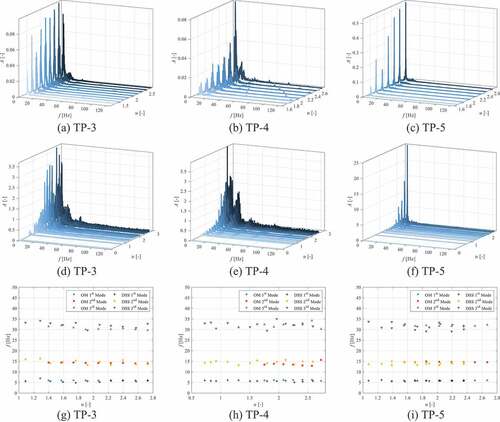
Fig. 20. Theoretical model comparison to (a) TP-1 (bare test pin), (b) TP-2, (c) TP-3, (d) TP-4, and (e) TP-5 results.
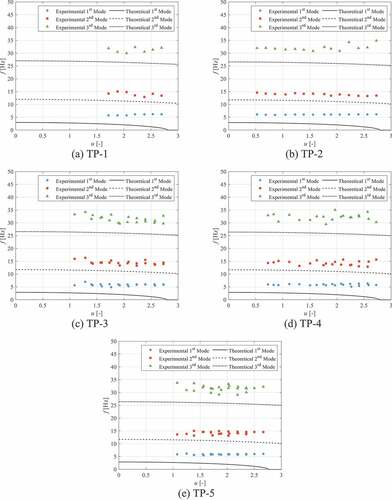
Fig. 21. Test Pin 5 with varying boundary conditions.
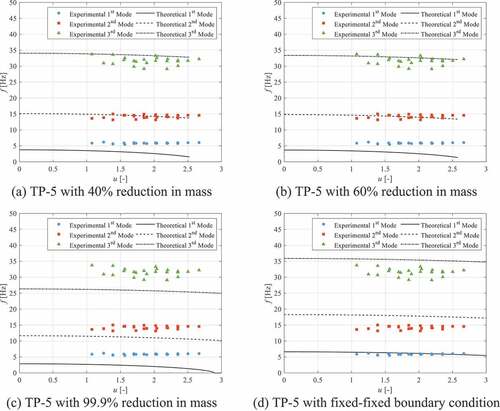
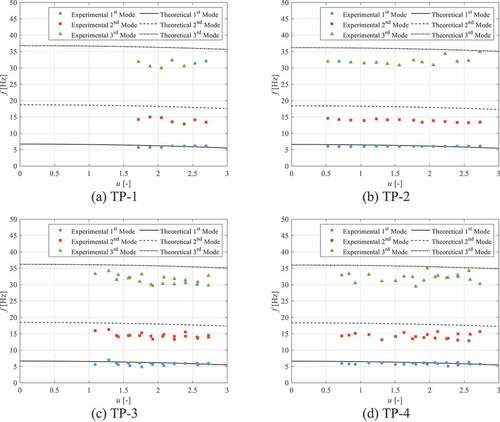
Fig. 22. Theoretical comparison to (a) TP-1, (b) TP-2, (c) TP-3, and (d) TP-4 with fixed-fixed boundary conditions.