Figures & data
TABLE I Density Profile of Water Coolant Where Node 1 Corresponds to the Top of the Assembly
Fig. 1. Radial cross-section view of the PWR assembly geometry.
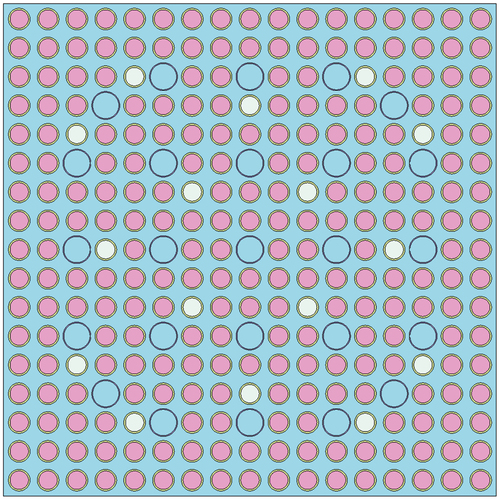
Fig. 2. Axial Shannon entropy for different group structures in the PWR assembly.
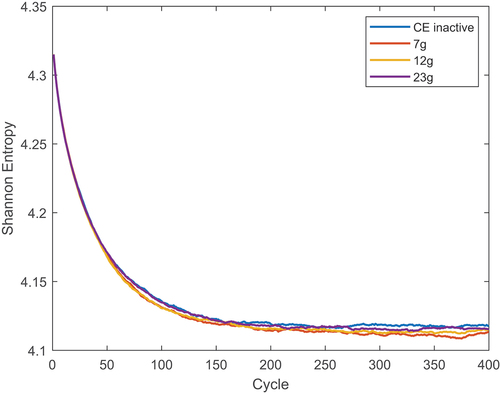
Fig. 3. Axial Shannon entropy for different group structures as a function of run time in the PWR assembly.
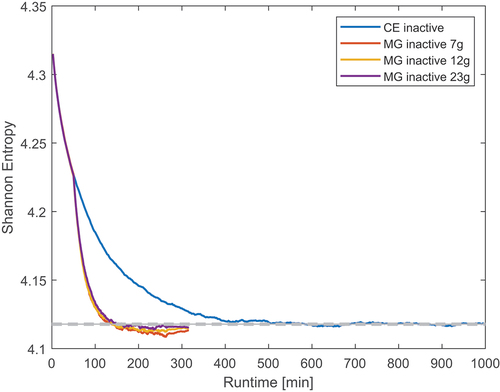
TABLE II Cross-Section Uncertainties (in %) for the PWR Assembly Materials
Fig. 4. Relative difference between MG and reference Shannon entropy when varying the number of cross-section generation cycles in the PWR assembly.
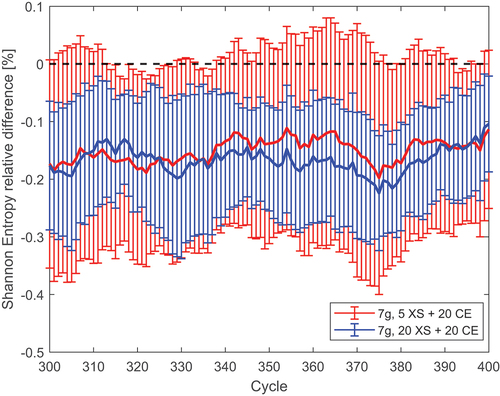
Fig. 5. Relative difference between MG and reference Shannon entropy when varying the group structure in the PWR assembly.
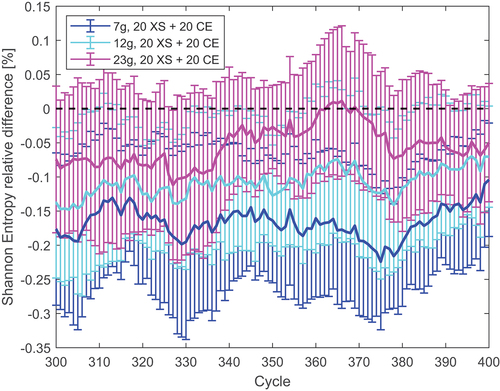
Fig. 6. Axial flux profile produced by different group structures in the PWR assembly.
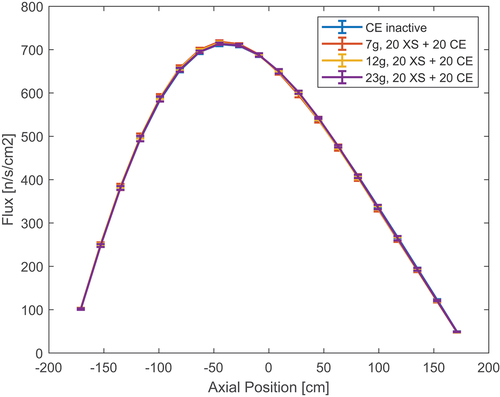
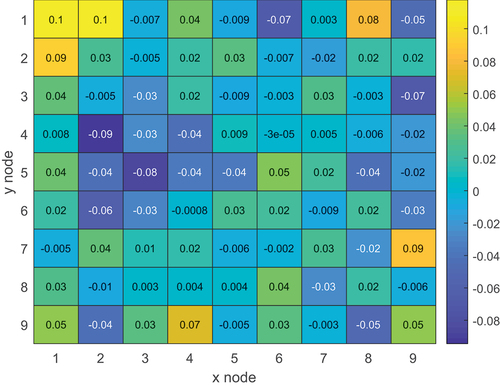
Fig. 7. Relative difference between MG and reference axial flux when varying the group structure in the PWR assembly.
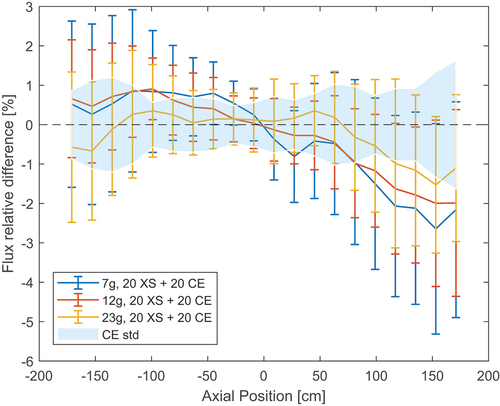
Fig. 8. Relative difference between MG and reference axial flux when using different cross-section generation and final CE cycle combinations in the PWR assembly.
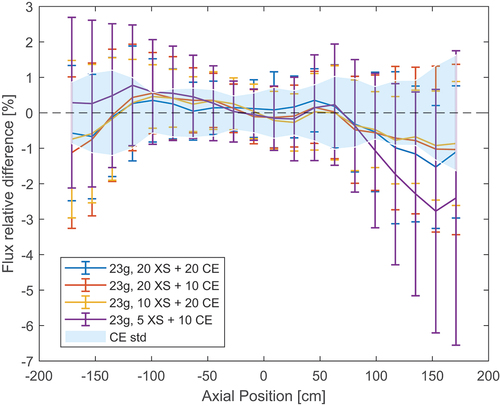
TABLE III Atomic Densities of the C5G7 Fuel Materials*
Fig. 9. C5G7 benchmark radial configuration.
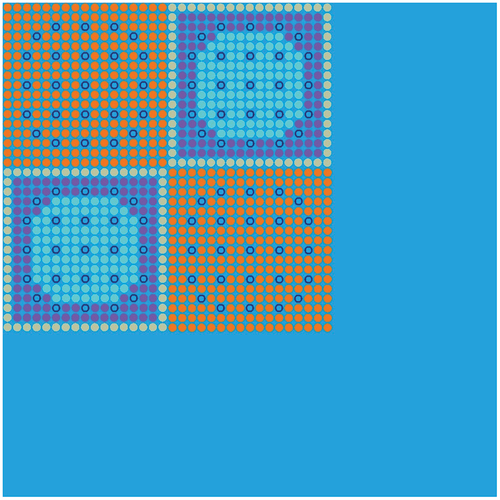
Fig. 10. Axial and radial Shannon entropy for different group structures in C5G7.
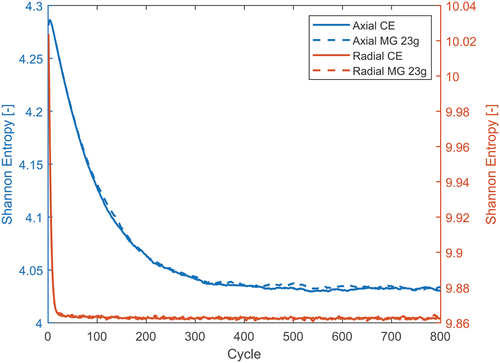
Fig. 11. Axial and radial Shannon entropy for different group structures as a function of run time in C5G7.
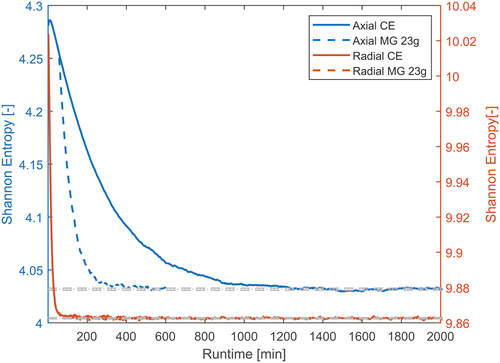
TABLE IV Cross-Section Uncertainties (in %) for the C5G7 23-Group Case
Fig. 12. Axial flux profile produced by different group structures in C5G7.
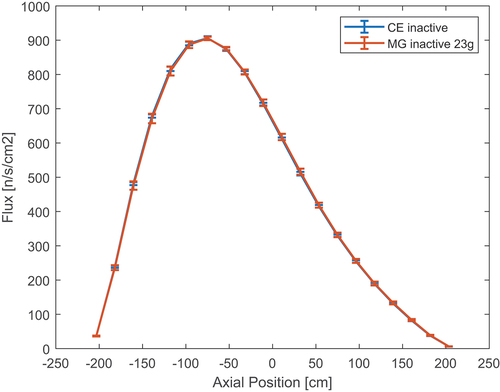
Fig. 13. Relative difference between MG and reference axial flux when using a different number of final CE cycles in C5G7.
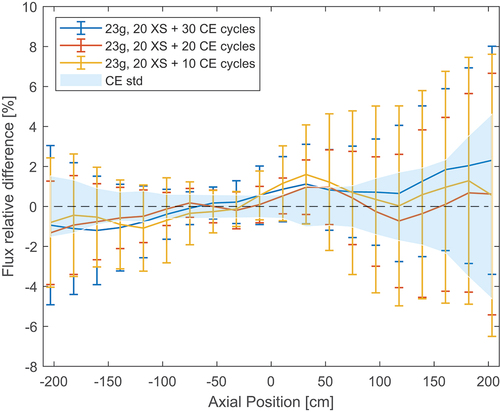
Fig. 14. Reference radial flux profile in C5G7.
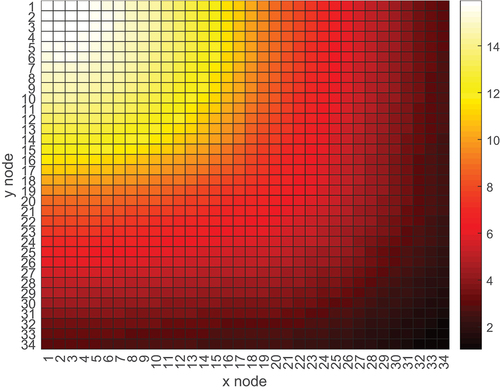
Fig. 15. Relative difference between 23-group MG (20 XS + 10 CE) and reference radial flux in C5G7.
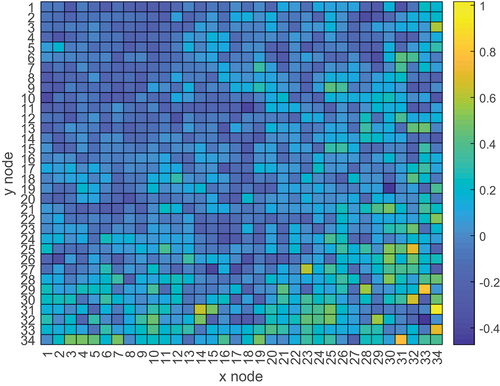
Fig. 16. Portion of burnt PWR assembly adopted for 1/8 symmetry.

Fig. 17. Relative difference between MG and reference axial flux when using different group structures in the burnt PWR assembly.
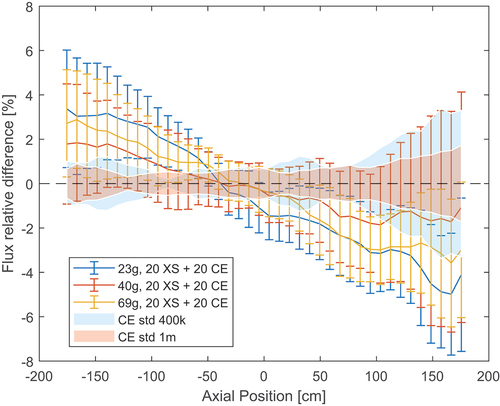
Fig. 18. Relative difference between MG and reference axial flux when using different neutron populations in the burnt PWR assembly.
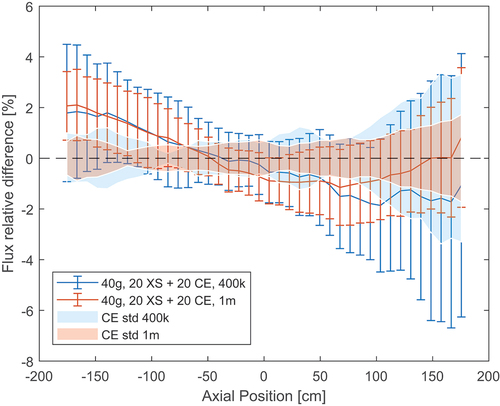
TABLE V Cross-Section Uncertainties (in %) for the Burnt PWR Assembly Materials
Fig. 19. Axial Shannon entropy for different neutron populations in the burnt PWR assembly with material grouping.
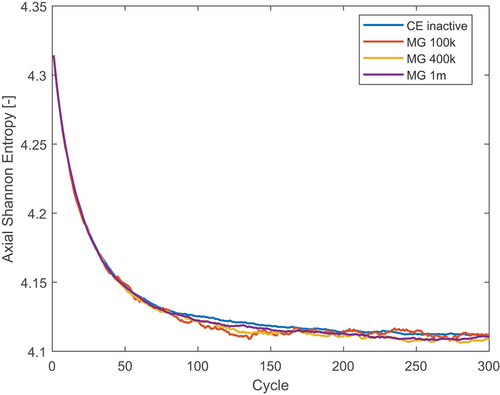
Fig. 20. Radial Shannon entropy for different neutron populations in the burnt PWR assembly with material grouping.
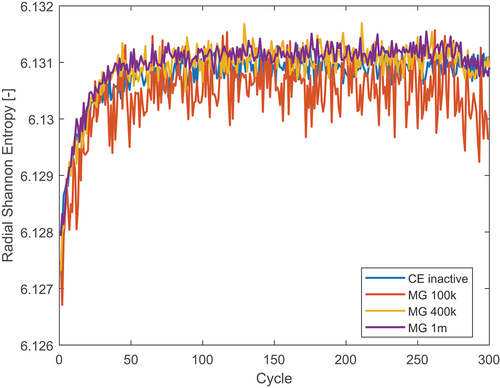
Fig. 21. Axial Shannon entropy as a function of run time for the 400 000-neutrons/cycle case in the burnt PWR assembly with material grouping.
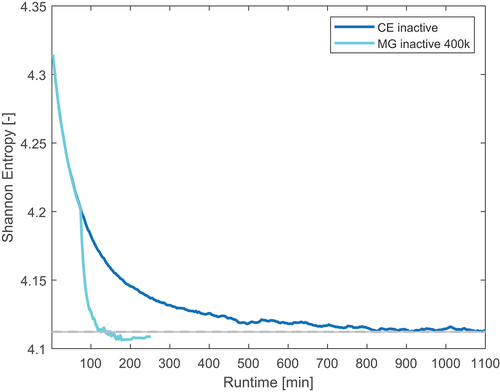
Fig. 22. Axial flux profile produced by different neutron populations in the burnt PWR assembly with material grouping.
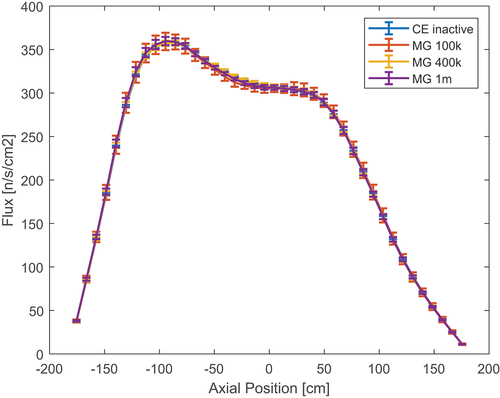
Fig. 23. Relative difference between MG and reference axial flux when using different neutron populations in the burnt PWR assembly with material grouping.
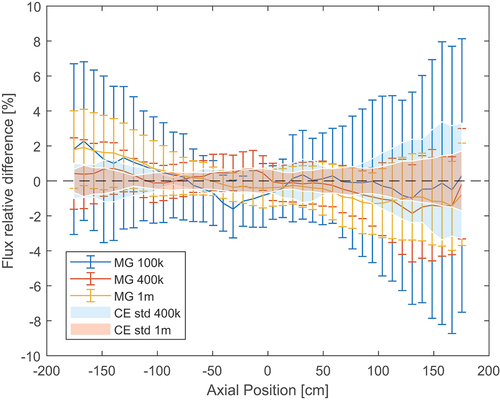
Fig. 24. Reference radial flux profile in the burnt PWR assembly with material grouping.
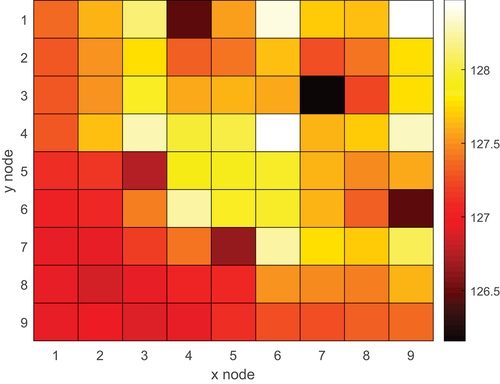
Fig. 25. Relative difference between 23-group MG (400 000 particles/cycle) and reference radial flux in the burnt PWR assembly with material grouping.