
Figures & data
Fig. 1. Representation of the stratification in corium in the lower head of the RPV that leads to the focusing effect. The majority of the dissipative heat flux by the metallic crust is by conduction to the perimeter of the RPV (after).Citation2
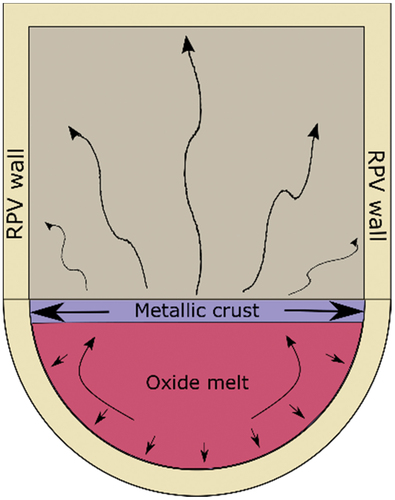
TABLE I Nominal Chemical Compositions of Arc-Melted Samples
Fig. 2. SEM BSE image of arc-melted sample F. Uranium-rich and Zr-rich phases are brighter in the image. Different phases are immiscible at the solid state but become fully mixed when the sample is heated and liquified. Electron acceleration voltage: 20 kV.
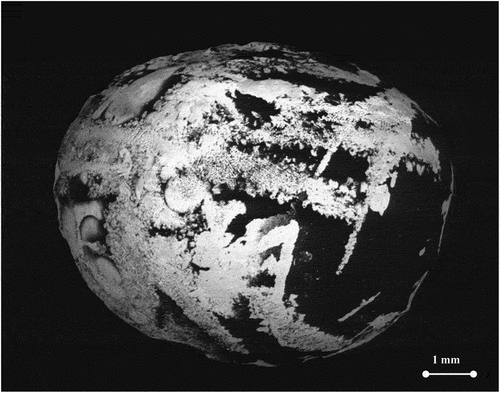
Fig. 3. The experimental apparatus used in the present research. The sample is placed inside a pressure vessel under argon or a mixture of Ar and H2 at 3 bars, fixed in place with graphite screws that minimize heat dissipation by conduction. The 1064-nm, 4.5-kW Nd:YAG laser heats the sample while the pyrometer and the spectrometer measure the intensity of the sample’s spectral radiance. Schematic adapted from Pavlov et al.Citation32 with permission from the authors.
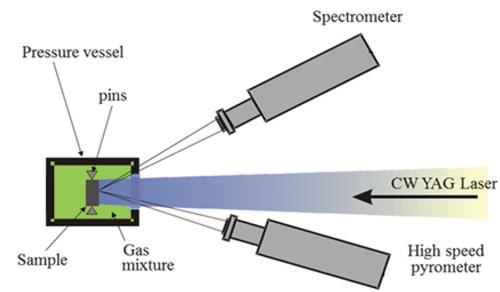
Fig. 4. The temperature response of sample E following a sequence of laser-heating pulses, representative of the sequences applied to all samples in the current study. The temperature shown on the y-axis corresponds to in EquationEq. (5
(5)
(5) ), as it has not been corrected using the sample’s spectral emissivity.
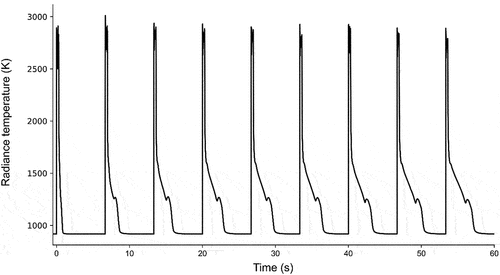
Fig. 5. Temperature variation of the medium-temperature phase transition in sample F, heated by four laser pulses under (a) Ar and (b) a mixture of Ar and H2. Both the absolute values of the transition temperatures and their variation during the pulse sequence vary as a result of the different atmosphere. The high-temperature phase transition is also visible as a smaller feature a few hundred degrees above the highlighted transition.
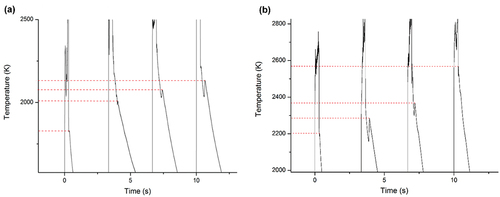
Fig. 6. Sample E under Ar+H2. (a) Complete thermogram in the course of the experiment. (b) Close-up view of the medium-temperature phase transition. The minimum temperature of the thermal arrest in the course of the laser-heating experiment is 1675 K while the maximum is 2065 K. A gray-body spectral emissivity of 0.43 was used to extract the true temperature of the sample, deduced according to the method described in Sec. II.B.
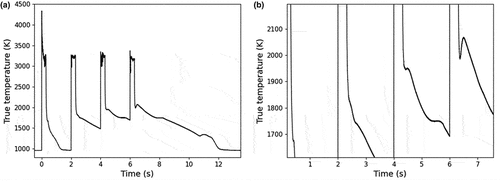
Fig. 7. Temperature evolution of the low-temperature phase transition in sample E under Ar+H2. Each dot represents the temperature at which the phase transition occurred. The total number of laser-heating thermal cycles that the sample had undergone up to the time of measurement for each dot is given on the x-axis. When the pressure vessel was vented and opened, the sample was exposed to air. At the H2-replenisment stages, the pressure vessel was brought down to vacuum and then refilled with Ar+H2 without exposure to air.
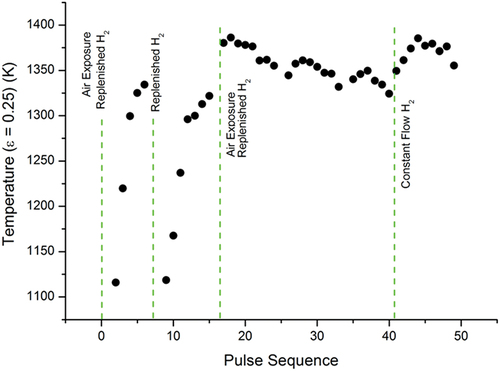
Fig. 8. Temperature evolution of the medium-temperature phase transition in sample E under a hydrogen-rich atmosphere. Each dot is plotted as in .
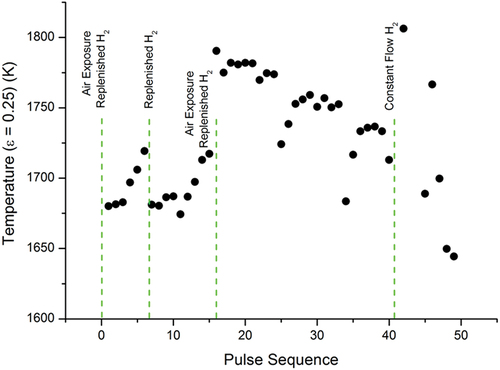
TABLE II Subset of the Datasets Used in the PCA Covariance Matrix
Fig. 9. PCA plot: projections along principal components 1 and 2 of the variations in phase transition temperatures during a sequence of four laser pulses. The units of each axis carry no physical meaning as they represent the principal components, i.e., the eigenvectors of the covariance matrix. Each dot is labeled according to the sample and the phase transition in question. If the atmosphere of the measurements was hydrogen rich, it is noted in parentheses. Distinct dots with an identical label represent variations in phase transition temperatures across different four-pulse sequences applied on the same sample.
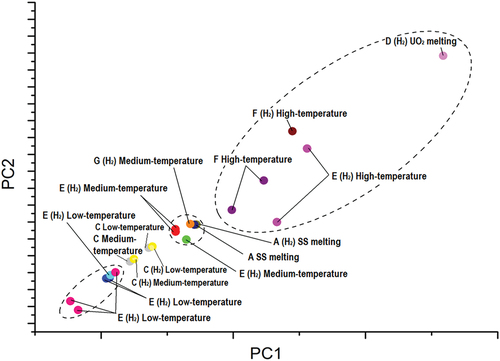
Fig. 10. Raman spectra of (a) sample E and (b) sample F, after prolonged exposure to air. The peak at ~445 cm−1 corresponds to the vibrational line in UO2 (CitationRef. 23).
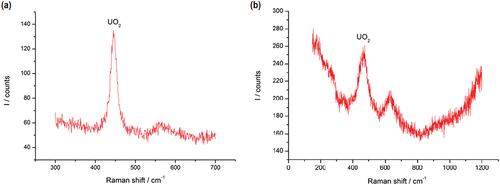
Fig. 11. Thermogram of sample B (80 at. % SS, 20 at. % Zr) during a sequence of four laser pulses under Ar. The y-axis shows the spectral temperature of the sample without conversion to the true sample temperature. A large exothermic release is observed following the second laser-heating thermal cycle. The release of heat sustains the sample at an elevated temperature for tens of seconds following the last laser-heating pulse.
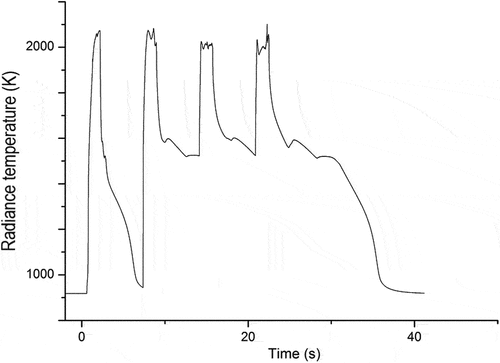
Fig. 12. Thermogram comparison for sample B, a sample of nuclear-grade SS, and a sample of Zircaloy-4 during a laser-heating cycle. The energy values shown on the legend represent the total energy delivered to each sample by the laser pulse. The measured emissivity for each value is shown next to each thermogram.
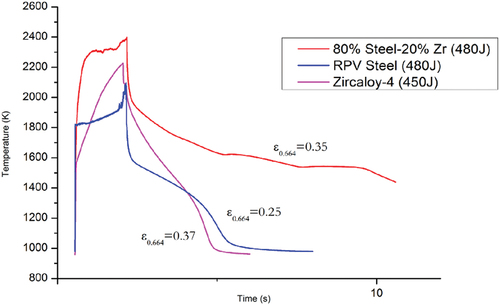
TABLE A.I Low-Temperature Phase Transition Temperatures Used in PCA
TABLE A.II Medium-Temperature Phase Transition Temperatures Used in PCA
TABLE A.III High-Temperature Phase Transition Temperatures Used in PCA