Figures & data
Fig. 1. Horizontal structure of the CHARM facility.
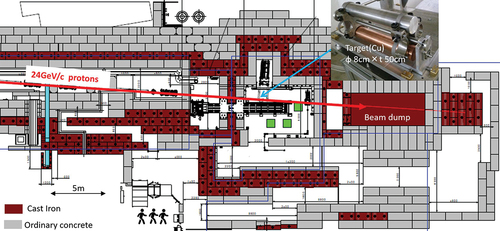
Fig. 2. Vertical cross section of the original shield structure in the CHARM facility perpendicular to the beam axis at the target location. The beam travels from the front to back of this figure.
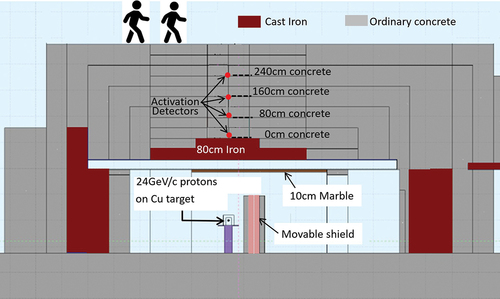
Fig. 3. Vertical cross section of the modified shield structure in the CHARM facility perpendicular to the beam axis at the target location. The beam travels from the front to back of this figure.
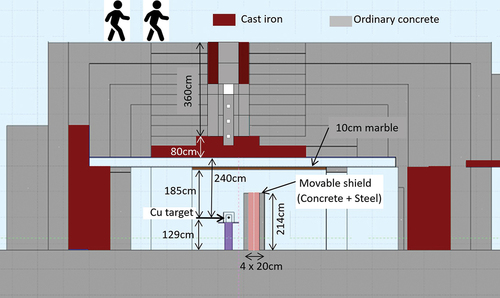
Fig. 4. Locations of the activation detectors and configurations of the measurement in the modified shield structure showing shielding experiments with (a) the removable sample concrete block, and (b) concrete and (c) steel shields in the material test location.
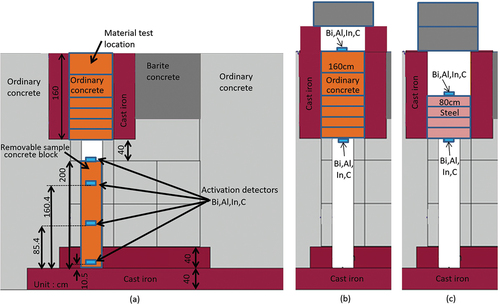
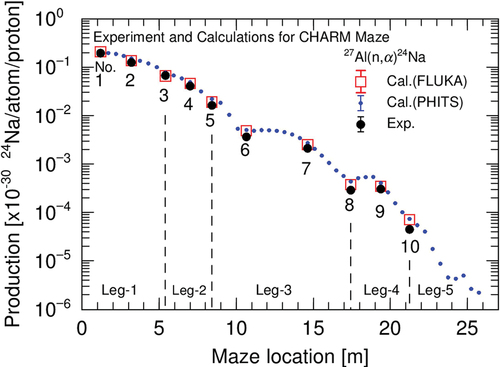
Fig. 5. Maze structure and detector locations.
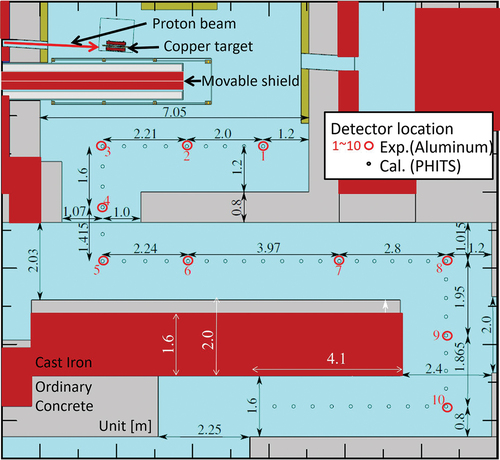
TABLE I Production Reactions, Half-Lives, and Photon Energies of the Radionuclides in the Activation Detectors
Fig. 6. Comparison of experimental and simulated attenuation profiles of the radionuclide production rates in the original shield structure in the CHARM facility.
Fig. 7. Attenuation profile of experimental and calculated production rates as a function of concrete thickness for the removable block configuration.
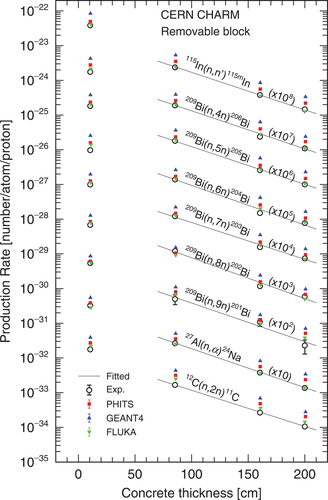
Fig. 8. Attenuation profile of experimental and calculated production rates as a function of concrete thickness in the material test location.
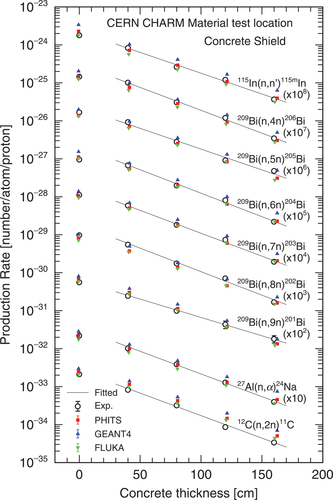
Fig. 9. Attenuation profile of experimental and calculated production rates as a function of steel thickness in the material test location.
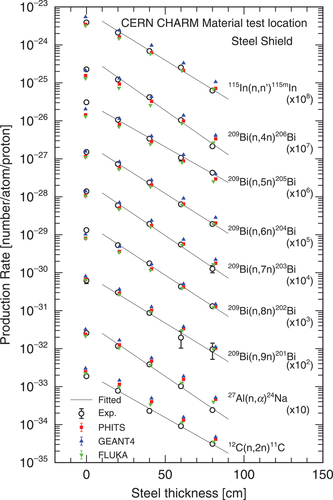
Fig. 10. Attenuation profile of experimental production rates along the maze compared with the calculated ones.