Figures & data
TABLE I Drawbacks Identified in the SINBAD Benchmark Documentation for the ASPIS Iron88, PCA ORNL, and PCA Replica Benchmarks
Fig. 1. ASPIS Iron88 experimental configuration.
Fig. 2. PCA ORNL 12/13 experimental configuration.
Fig. 3. Layout of the PCA Replica 12/13 experimental configuration.
TABLE II Experimental and Computational Nuclear Data Uncertainties for the Reaction Rates Measured in the ASPIS Iron88 Benchmark
TABLE III Experimental and Computational Nuclear Data Uncertainties for the Reaction Rates Measured in the PCA Replica Benchmark
Fig. 4. ASPIS Iron88 benchmark: C/E ratios for the 103Rh(n,n’) and 115In(n,n’) reaction rates calculated using the MCNP code and cross sections from the FENDL-3.2 and 2.1, JEFF-3.3, ENDF/B-VIII.0, and JENDL-4.0u evaluations. Dashed lines delimit the ±1σ measurement standard deviations. Examples of ±1σ computational (nuclear data) uncertainties calculated using the SUSD3D codes are shown.
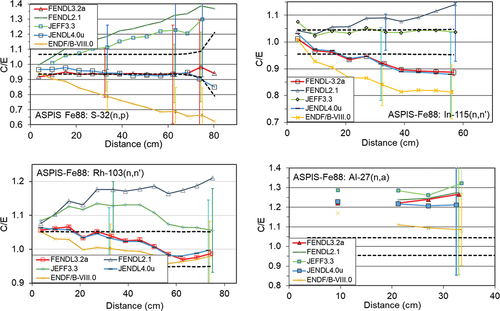
Fig. 5. PCA Replica and PCA ORNL benchmarks: C/E ratios for the 103Rh, 115In, and 32S/58Ni activation foils calculated using the MCNP code and cross sections from the FENDL-3.2 and 2.1, JEFF-3.3, ENDF/B-VIII.0, and JENDL-4.0u evaluations. Dashed lines delimit the ±1σ measurement standard deviations. (c) Comparison of the C/Es for two reactions having approximately similar thresholds: 32S(n,α) (ASPIS Iron88) and 58Ni(n,p) (PCA Replica).
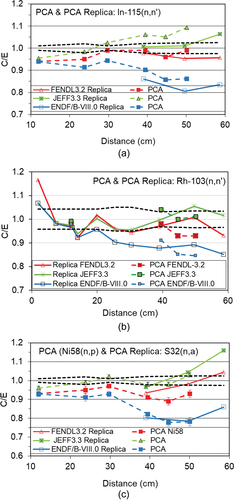
Fig. 6. Comparison of the ASPIS Iron88 and PCA Replica benchmark results for the 32S reaction rates. (a) C/E ratios calculated using the MCNP code and cross sections from the FENDL-3.2 and 2.1, JEFF-3.3, ENDF/B-VIII.0, and JENDL-4.0u evaluations. Dashed lines delimit the ±1σ measurement standard deviations. (b) Sensitivity of the 32S(n,p) reaction rates at the deepest measurement positions in the ASPIS Iron88 (position A14 at 74 cm) and PCA Replica (position A7 at 59 cm) benchmarks to the 56Fe inelastic and elastic cross sections. Legend: “Fe88_S_A14 Inel Fe56” stands for the sensitivity of the 32S reaction rate at position A14 to the inelastic cross section of 56Fe, etc.
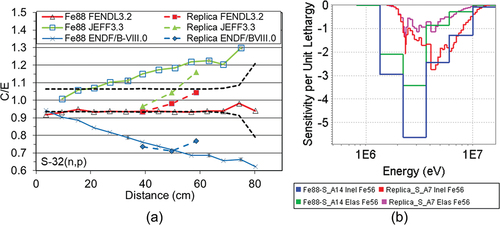
Fig. 7. Comparison of the ASPIS Iron88 and PCA Replica benchmark results for the 115In reaction rates. (a) C/E ratios calculated using the MCNP code and cross sections from the FENDL-3.2 and 2.1, JEFF-3.3, ENDF/B-VIII.0, and JENDL-4.0u evaluations. Dashed lines delimit the ±1σ measurement standard deviations. (b) Sensitivity of the 115In reaction rates at the deepest measurement positions in the ASPIS Iron88 (position A11 at 57 cm) and PCA Replica (position A7 at 59 cm) benchmarks to 56Fe inelastic and elastic cross sections. Legend: “Fe88_In_A11 Inel Fe56” stands for the sensitivity of the 115In reaction rate at position A11 to the inelastic cross section of 56Fe.
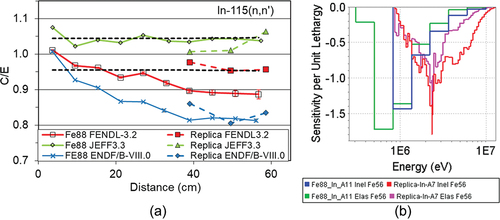
Fig. 8. Comparison of the ASPIS Iron88 and PCA Replica benchmark results for the 103Rh reaction rates. (a) C/E ratios calculated using the MCNP code and cross sections from the FENDL-3.2 and 2.1, JEFF-3.3, ENDF/B-VIII.0, and JENDL-4.0u evaluations. Dashed lines delimit the ±1σ measurement standard deviations. (b) Sensitivity of the 103Rh reaction rates at the deepest measurement positions in the ASPIS Iron88 (position A14 at 74 cm) and PCA Replica (position A7 at 59 cm) benchmarks to 56Fe inelastic and elastic cross sections. Legend: “Fe88_Rh_A14 Inel Fe56” stands for the sensitivity of the 103Rh reaction rate at position A14 to the inelastic cross section of 56Fe, etc.
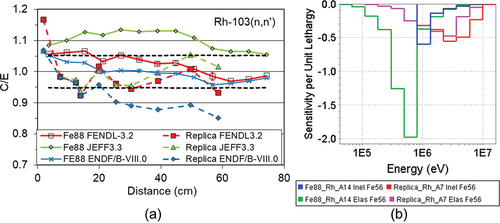
Fig. 9. Sensitivity of the 32Al(n,α), 58Ni(n,p), 103Rh(n,n’), and 115In(n,n’) reaction rates at the measurement position D6 (~50 cm) in the PCA ORNL benchmark to the 56Fe inelastic cross sections calculated using the MCNP6 code.
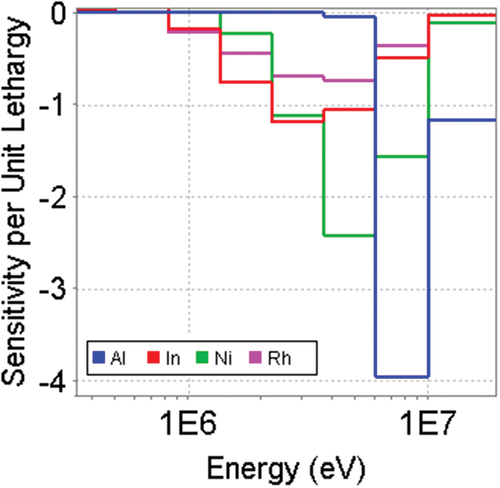
Fig. 10. The ASPIS Iron88 and PCA ORNL benchmarks: C/E ratios for the 27Al(n,α) reaction rates calculated using the MCNP code and cross sections from the FENDL-3.2 and 2.1, JEFF-3.3, ENDF/B-VIII.0, and JENDL-4.0u evaluations. Dashed lines delimit the ±1σ measurement standard deviations. Examples of ±1σ computational (nuclear data) uncertainties calculated using the SUSD3D codes are shown.
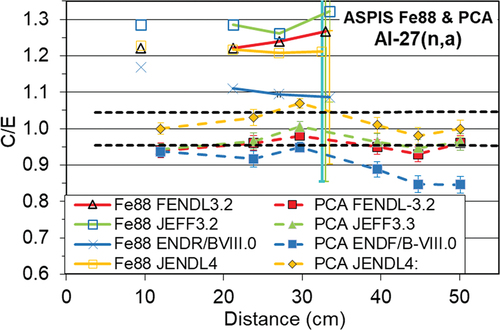
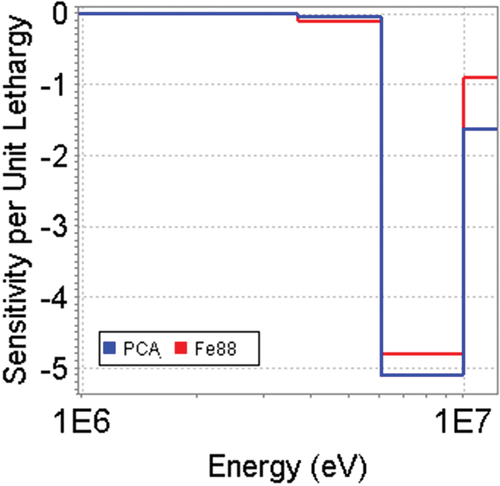
Fig. 11. Sensitivity of the 27Al(n,α) reaction rate at the deepest measurement positions in the ASPIS Iron88 and PCA ORNL benchmarks to 56Fe inelastic cross sections.