Figures & data
Fig. 1. Depiction of the spatial and directional coordinate system used in the neutron transport equation.
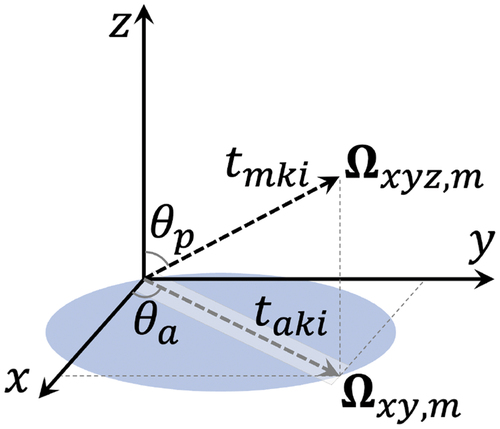
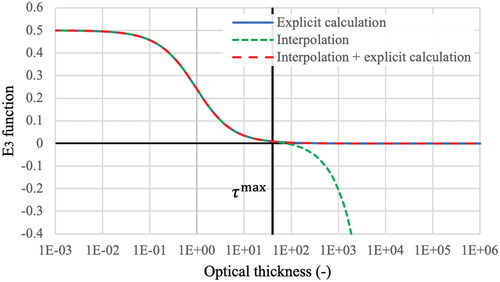
Fig. 2. function calculation.
Algorithm 1 LIFA LSA algorithm for each MOC transport sweep
Algorithm 2 TCP0 or P0 LSA algorithm for each MOC transport sweep
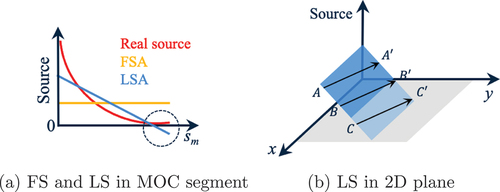
Fig. 3. Illustration of a locally negative LS.
Algorithm 3 LLSA algorithm for each MOC transport sweep
Fig. 4. Geometry and materials of the 2D C5G7 benchmark.
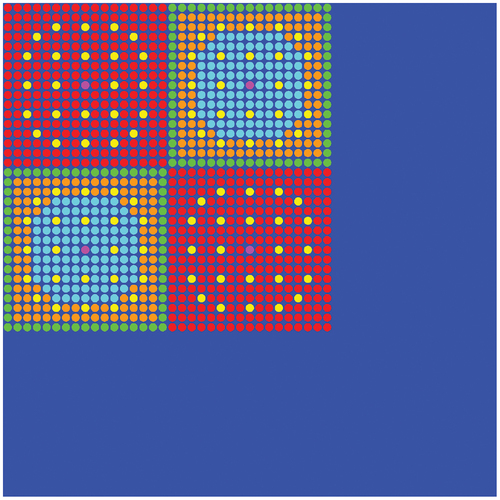
TABLE I Mesh Options for the 2D C5G7 Benchmark
TABLE II The Relative Number of Source Regions and MOC Segments of C5G7 Problem
TABLE III Accuracy Comparisons for the C5G7 2D Benchmark Calculation Using Different Source Approximations and Meshes
Fig. 5. C5G7 problem pin power differences (in units of percent).
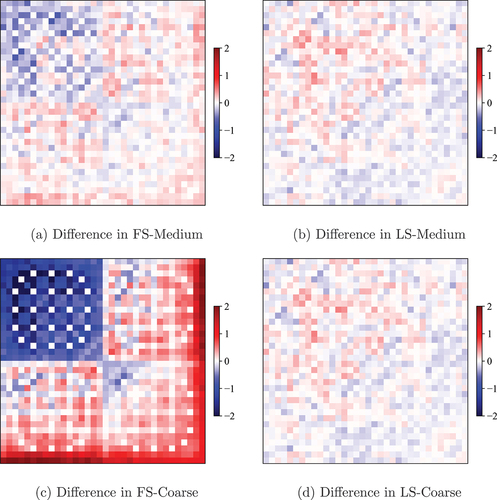
TABLE IV Performance Comparisons for the C5G7 2D Benchmark Calculation Using Different Source Approximations and Meshes
TABLE V Mesh Options for the 2D Fuel Assembly Problems
Fig. 6. The relative number of source regions and MOC segments.
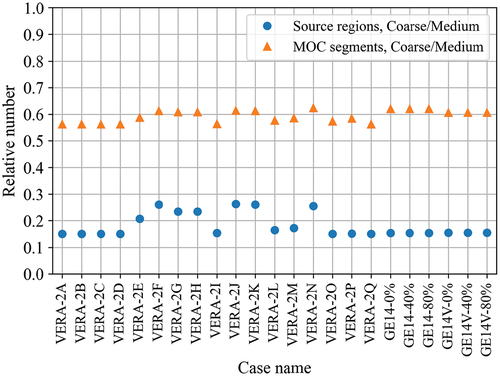
TABLE VI Case-Averaged Differences for Eigenvalue and Pin Power Distribution with TCP0 Scattering
TABLE VII Case-Averaged Difference for Eigenvalue and Pin Power Distribution with P2 Scattering
Fig. 7. Eigenvalue difference (compared to fine mesh case) for TCP0 scattering.
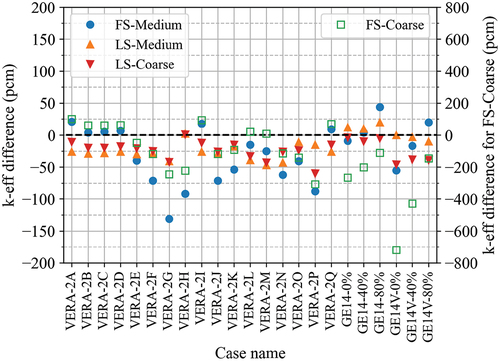
Fig. 8. Pin power difference (compared to fine mesh case) for TCP0 scattering.
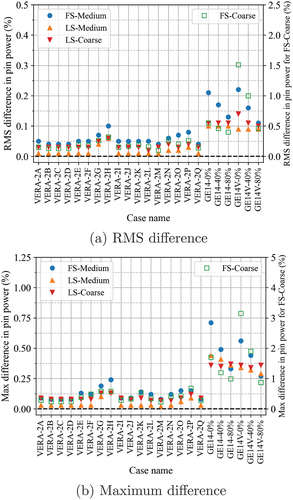
Fig. 9. Eigenvalue difference compared to fine mesh calculation with P2 scattering.
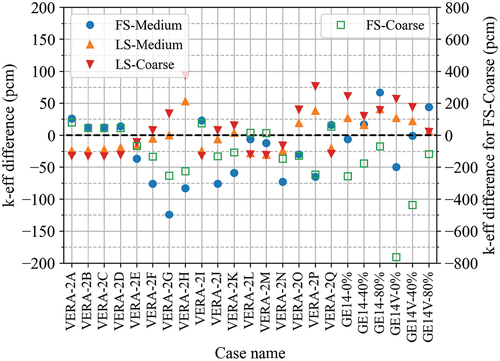
Fig. 10. Difference in pin power compared to fine mesh calculation with P2 scattering.
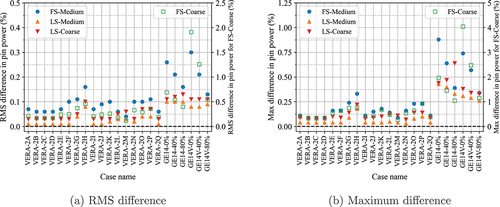
TABLE VIII Case-Averaged Relative Run Time and Memory with TCP0 Scattering
TABLE IX Case-Averaged Relative Run Time and Memory with P2 Scattering
TABLE X VERA-5A 2D Core Problem Eigenvalue and Pin Power Results with TCP0
TABLE XI VERA-5A 2D Core Problem Eigenvalue and Pin Power Results with P2
Fig. 11. VERA-5A 2D core problem pin power differences with P2 (in units of percent).
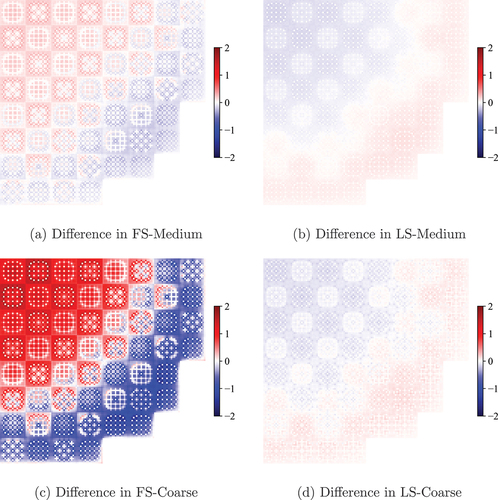
TABLE XII VERA-5A 2D Core Problem Relative Run Time and Memory with TCP0
TABLE XIII VERA-5A 2D Core Problem Relative Run Time and Memory with P2
TABLE XIV Burnup-Averaged Eigenvalue and Pin Power Differences for VERA 2A Depletion Problem
TABLE XV Burnup-Averaged Eigenvalue and Pin Power Differences for VERA 2P Depletion Problem
Fig. 12. VERA 2A depletion problem results.
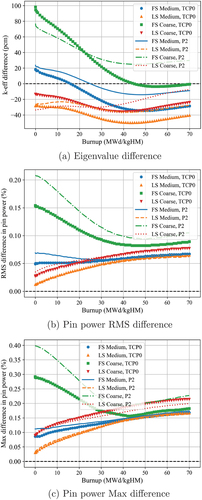
Fig. 13. VERA 2P depletion problem results.
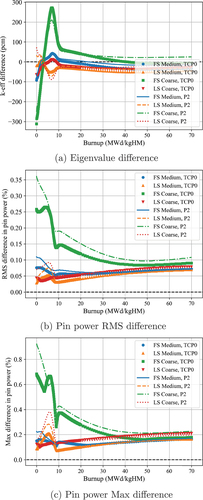
TABLE XVI VERA 2A Depletion Step-Averaged Relative Run Time and Memory with TCP0 Scattering
TABLE XVII VERA 2P Depletion Step-Averaged Relative Run Time and Memory with TCP0 Scattering
TABLE XVIII VERA 2A Depletion Step-Averaged Relative Run Time and Memory with P2 Scattering
TABLE XIX VERA 2P Depletion Step-Averaged Relative Run Time and Memory with P2 Scattering
TABLE XX VERA Problem 6 3D Single-Assembly Eigenvalue and Pin Power Results with TCP0
TABLE XXI VERA Problem 6 3D Single-Assembly Eigenvalue and Pin Power Results with P2
TABLE XXII VERA Problem 6 Relative Run Time and Memory with TCP0
TABLE XXIII VERA Problem 6 Relative Run Time and Memory with P2
Fig. 14. Problem geometries.
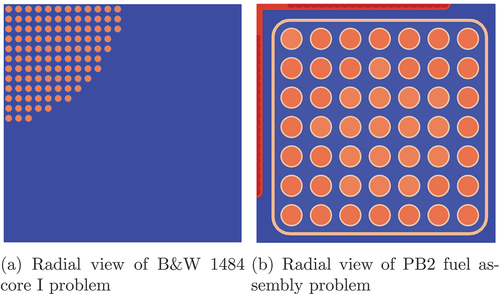
TABLE XXIV Numerical Results from B&W 1484 Core I Simulations
TABLE XXV Numerical Results from PB2 Assembly Simulations
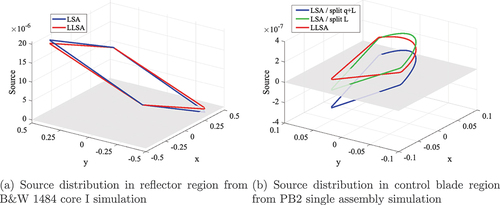
Fig. 15. Comparisons between LSA and LLSA.