Figures & data
Fig. 1. (a) Photographs of the experimental setup for the interrogation of depleted uranium and (b) screenshot of the detailed geometry of the laboratory space defined in MCNPX-PoliMi.
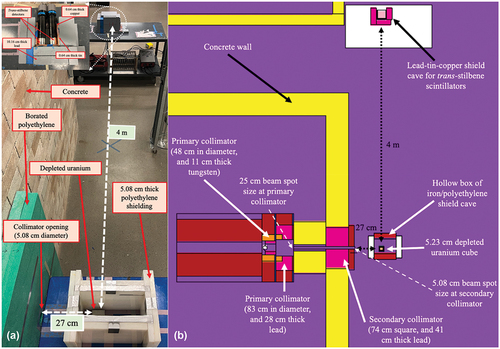
Fig. 2. (a) Traditional charge integration method for PSD analysis (represented scintillation events are detected voltage pulses when particles deposit 2-MeV energy) and (b) neutron and photon tail and total pulse integrals for a 252Cf spontaneous fission source (measured with a 5.08-cm-long and 5.08-cm-diameter trans-stilbene detector).
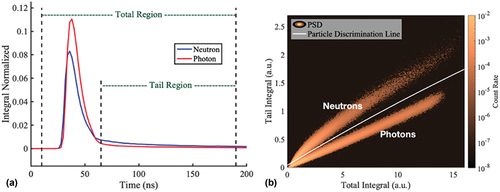
Fig. 3. Breakdown of scintillation pulses from the trans-stilbene detectors during interrogation of depleted uranium: (a) iron shielded configurations and (b) polyethylene shielded configurations.
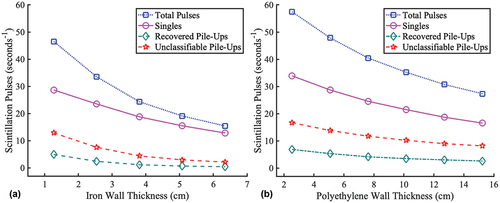
Fig. 4. Neutron and photon tail and total pulse integrals for depleted uranium shielded in (a) 1.27 cm of iron (with pile-up events), (b) 1.27 cm of iron (without pile-up events), (c) 6.35 cm of iron (with pile-up events), and (d) 6.35 cm of iron (without pile-up events).
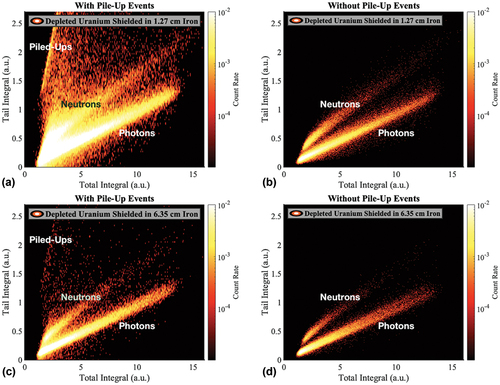
Fig. 5. Neutron and photon tail and total pulse integrals for depleted uranium shielded in (a) 2.54 cm of polyethylene (with pile-up events), (b) 2.54 cm of polyethylene (without pile-up events), (c) 15.24 cm of polyethylene (with pile-up events), and (d) 15.24 cm of polyethylene (without pile-up events).
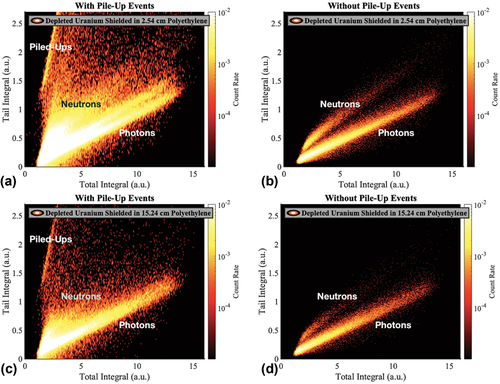
Fig. 6. Measured and simulated light output distributions for a 252Cf spontaneous fission source. (Errors bars are from Poisson counting statistics and are represented within one standard deviation. The inset shows the light output distribution in logarithmic y-scale.).
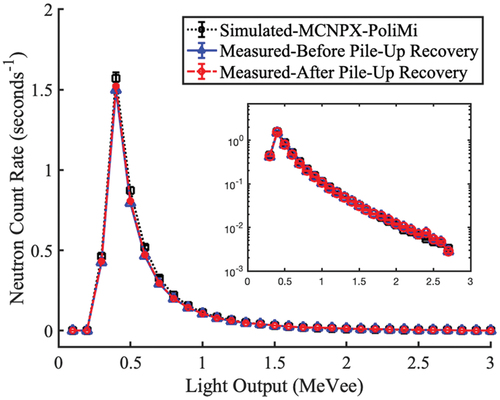
Fig. 7. ENDF/B-VII photonuclear cross-section data[Citation7] for 238U superimposed with the bremsstrahlung photon spectrum.
![Fig. 7. ENDF/B-VII photonuclear cross-section data[Citation7] for 238U superimposed with the bremsstrahlung photon spectrum.](/cms/asset/1933ebba-9853-48bc-8bde-d86780bc913b/unse_a_2238169_f0007_oc.jpg)
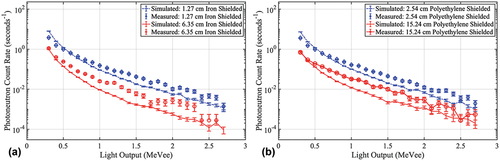
Fig. 8. Simulated and active background subtracted photoneutron count rates: (a) depleted uranium shielded in varying thicknesses of iron and (b) depleted uranium shielded in varying thicknesses of polyethylene. (Error bars are from Poisson counting statistics and are represented within one standard deviation).
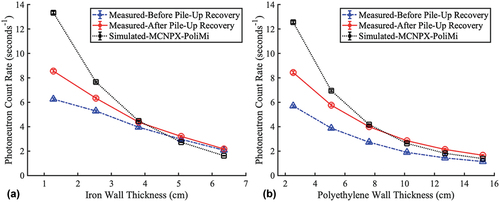
Fig. 9. Normalized photoneutron light output distributions for depleted uranium shielded in (a) 2.54-cm-thick iron and (b) 2.54-cm-thick polyethylene. (Error bars are represented within one standard deviation).
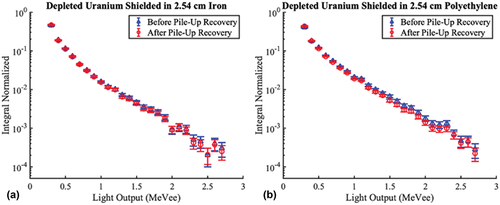
Fig. 10. Simulated and active background subtracted photoneutron light output distributions for the least and greatest thicknesses of (a) iron shielding and (b) polyethylene shielding. (Error bars are from Poisson counting statistics and are represented within one standard deviation).