Figures & data
Fig. 1. Discrepancies exist between major evaluations on the mean values of cross sections and where specific cross-section models should be applied. As an example, total cross section is shown here. None of the evaluations include uncertainty information.
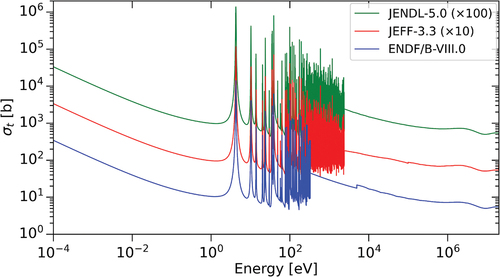
TABLE I Experimental Parameters for All Three Experiments*
Fig. 2. Sample-in and sample-out count rates and corresponding backgrounds. The solid lines represent the measured open beam count rate and calculated open background count rate. The dashed lines represent the sample count rate and calculated sample background count rate.
Fig. 3. All three transmission measurements. Note the large variance at 5.9 and 35 keV caused by structural Al.
Fig. 4. ENDF/B-VIII.0 resonance parameters are used in a SAMMY calculation to model the experimental transmission. The end of the ENDF/B-VIII.0 RRR is shown here, where a poor fit to the 330-eV resonance can be seen. Note that sample “1 mm - a” is nearly identical but physically different from sample “1 mm - b” used in the capture measurements.
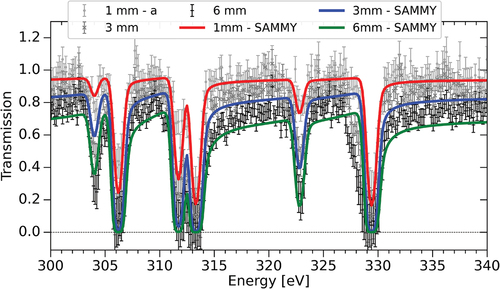
Fig. 5. Covariance for transmission as a function of energy, linearly propagated from the systematic and statistical uncertainty in the variables of EquationEq. (2)(2)
(2) .
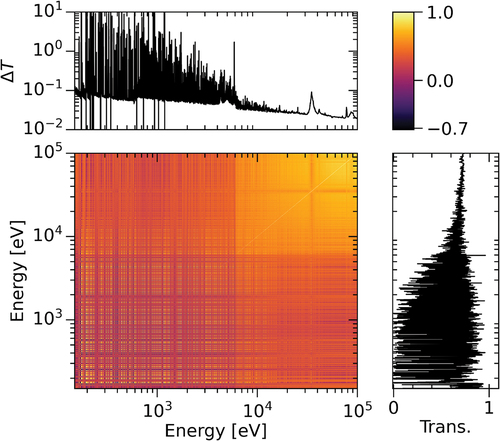
Fig. 6. Capture yield for the 1- and 2-mm samples. Though capture yield should never be greater than unity, the uncertainty band in this case includes values that are . This is expected because the normalization introduces
uncertainty. Note that the 1-mm sample includes the identifier “b,” which simply indicates that it is a different 1-mm sample from that of the 100-m transmission measurement (which was “1 mm – a”). The difference between “a” and “b” is mostly negligible, but each has unique documentation.
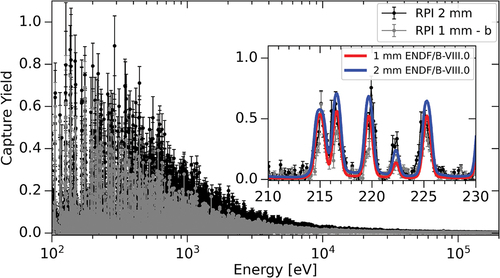
Fig. 7. The count rate for the thick Ta transmission validation measurement. The solid lines represent the measured open beam count rate and calculated open background count rate. The dashed lines represent the sample count rate and calculated sample background count rate.
Fig. 8. (Top) 12-mm Ta and (bottom) thick U sample transmissions as measured at the 35-m detector. Notice the matching structure in each measurement at 132 eV from the Co fixed notch and 5.9, 35, and 88 keV from the Al fixed notch.
Fig. 9. Correlation, transmission, and standard deviation for the 12-mm Ta sample measured at 35 m. Spikes in uncertainty correspond to low count rates at resonances of Co and Al.
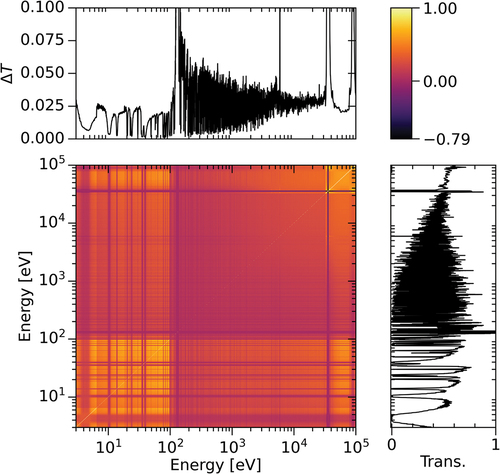
Fig. 10. ENDF/B-VIII.0 resonance parameters were used as input to SAMMY to calculate theoretical neutron transmission and capture yield as a comparison to the measurements. The fit becomes worse as energy increases toward 330 eV.
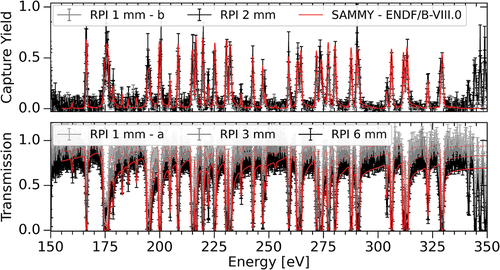
TABLE II Resulting Values from the Fits for Each Sample Measurement and Each Library*
Fig. 11. The experimental energy resolution based on SAMMY 8.1 fit to 238U. The 100-m transmission and 45-m capture yield measurements are capable of resolving resonances beyond 2.5 keV (upper limit of JEFF-3.3), and the 35-m validation transmission is capable of resolving resonances up to approximately 1.5 keV. The width plotted here is taken as the full-width at half-maximum of the resolution function at a given neutron energy. The 100-m transmission with the 3-mm sample is shown for comparison to the resolution function on the inset plot.