Figures & data
TABLE I Tabulated Materials Used for the Individual Components of the Models
TABLE II Overview of the Dimensions of the Reference Model*
Fig. 1. Exploded view of the components of each model.
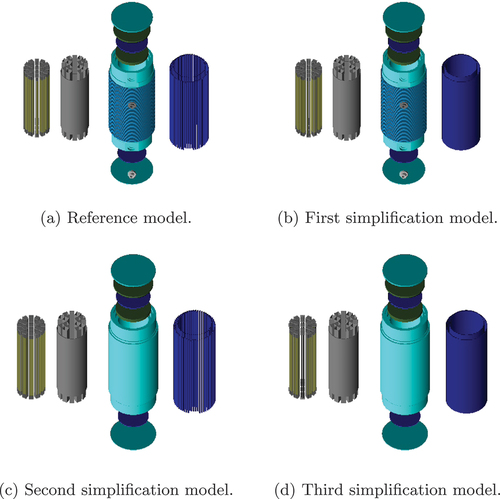
Fig. 2. Depiction of the orientation of the cask models in the x-, y-, and z-directions relative to the detector plates.
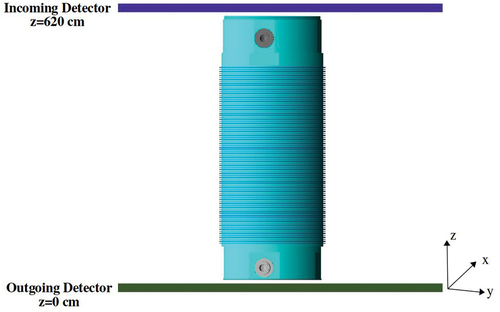
Fig. 3. Scattering images for all models with and without fuel assemblies, as well as difference scattering images. The color code represents the mean of the effective scattering angle distribution (in degrees) for each pixel, with the x- and y-positions indicating the muon position after traversing the incoming detector.
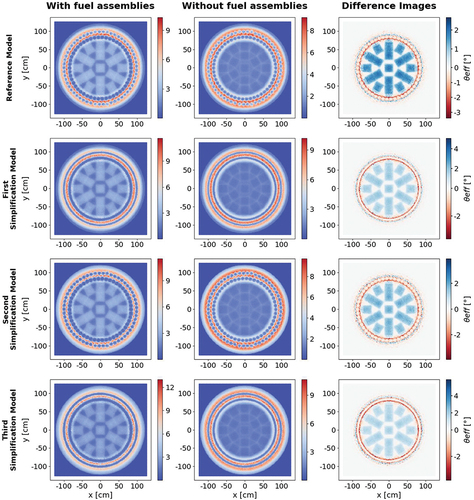
Fig. 4. Cross-sectional view of the fuel basket, highlighting the fuel assemblies selected for further analysis. These fuel assemblies are labeled with ID numbers 1 through 7 and are color-coded gray for clarity. The fuel assembly had a one-quarter symmetry. Fuel assemblies 5 and 7 were chosen for analysis due to their proximity to the trunnions, while fuel assemblies 4 and 6 were selected for comparison. Fuel assemblies 2 and 3 were chosen for a comprehensive assessment.
TABLE III Calculated Test Statistics for the Anderson-Darling Test and the Calculated p-Value for the Kolmogorov-Smirnov and Kuiper’s Tests After Comparison Between the Reference Model and All Simplified Models*
Fig. 5. Illustration of the rejection of the null hypothesis after comparing the difference data of the simplified models to the simplified models. The fuel assembly regions are colored turquoise if the data sets with the scattering angles contained therein led to a rejection of the null hypothesis. The results for all three tests for simulations performed with 4.5 million and 15 million muons are shown in (a) and (b), respectively.
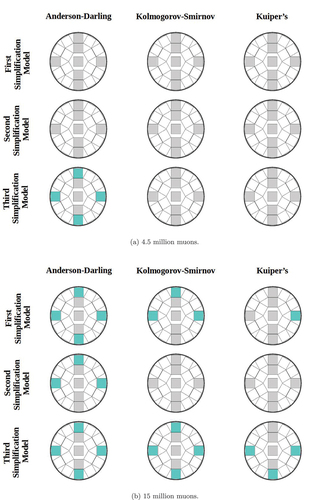
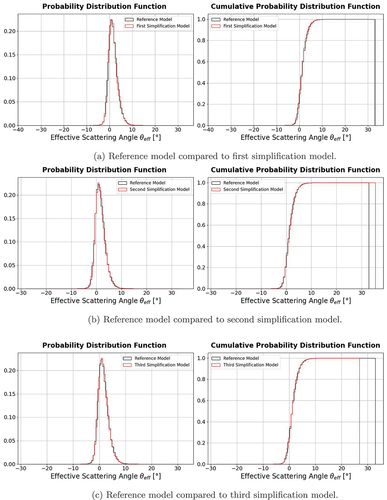
Fig. 6. (left) Comparison of the probability distribution function and (right) the cumulative probability function of the reference model (black) with the simplified models (red) of scatter data stored in the pixels representing fuel assembly 5 generated using 15 million muons.