
Figures & data
Fig. 1. Proprietary System, Water Pumped into Leaking Reservoir. Variables, a1 through a5, labeled with Red Arrows.
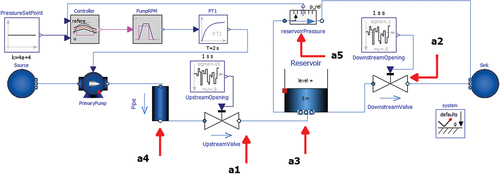
TABLE I Description of Simulation Variables, Proprietary System
TABLE II Description of Simulation Variables, Generic System
Fig. 2. Generic System, Series of Heated Pipes. Variables, b1 through b5, labeled with Red Arrows.
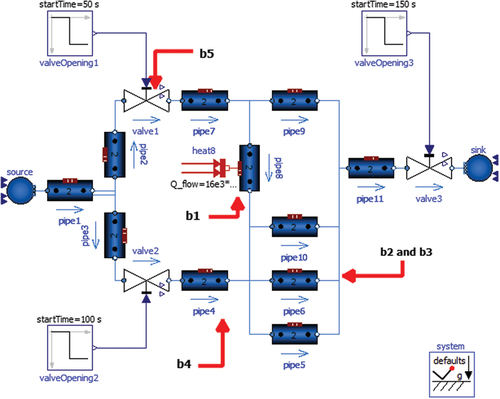
Fig. 3. Proprietary System Modified for the Prominent Anomaly Case. Anomalous Valves Highlighted in Gray as “AnomalousValve1” through “AnomalousValve4” whose openings are determing by “AnomalousLeakage1” through “AnomalousLeakage4.”
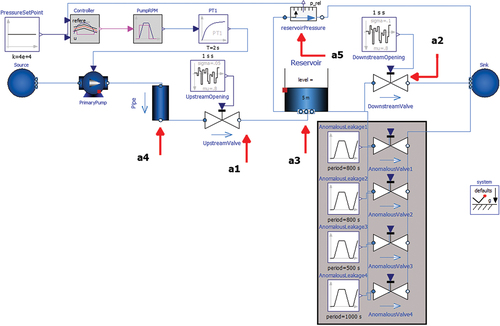
TABLE III Details of Pipe Leakage Anomalies, Prominent Anomaly Case
Fig. 4. Prominent Anomaly Case, Power of Flow through the Reservoir.
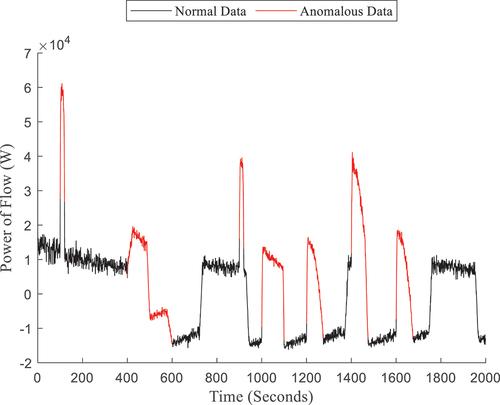
Fig. 5. Generic Data, Temperature of Fluid at Pipe 8.
Fig. 6. Prominent Anomaly Case, Masked Power of Flow through the Reservoir.
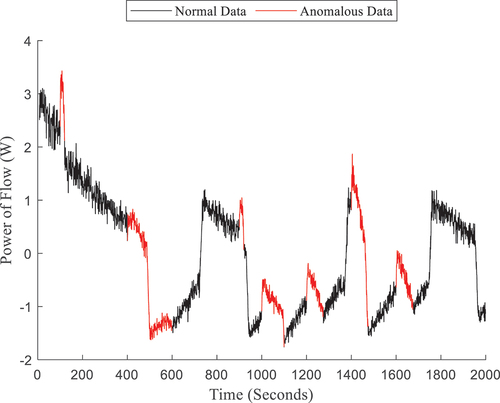
Fig. 7. Prominent Anomaly Case, volumetric flow through “DownstreamValve” versus power of flow from “Reservoir.”
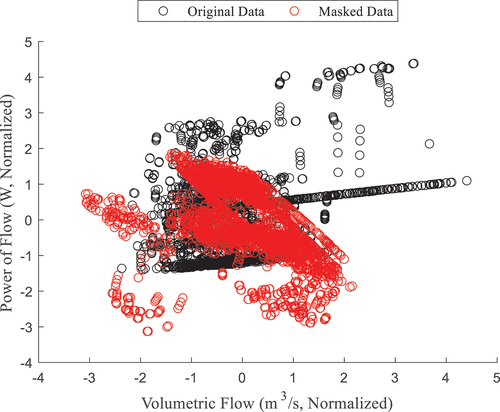
Fig. 8. Comparison of power of flow through reservoir across experiments. Left, Prominent Anomaly Case (restatement of Fig. 4). Right, Subtle Anomaly Case.
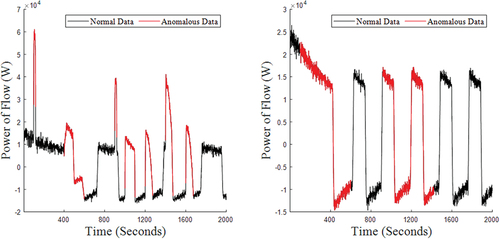
Fig. 9. Subtle Anomaly Case, Volumetric Flow through the Downstream Valve vs. Power of Flow through the Reservoir.
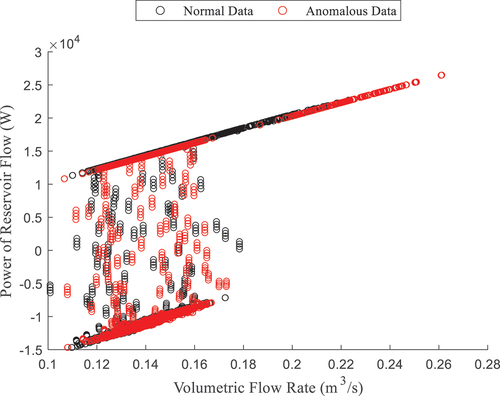
Fig. 10. Subtle Anomaly Case, Volumetric Flow through the Downstream Valve Colored in Black, Volumetric Flow through AnomValve1 Colored in Red.
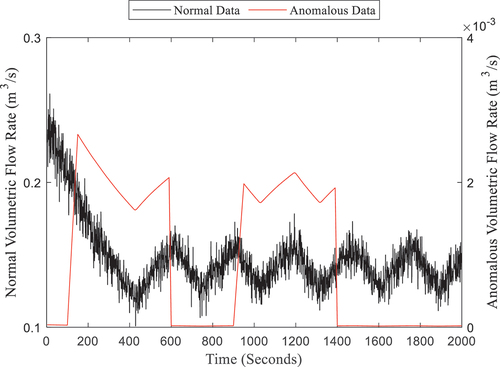
Fig. 11. Proprietary System Modified for the Multi-Regime Anomaly Case. Controller Set Point Highlighted in Orange, Secondary Pump Highlighted in Blue, Anomalous Valves Highlighted in Gray.
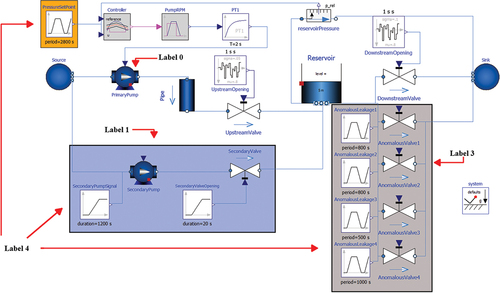
TABLE IV Description of Anomalous Regimes
TABLE VI Classification Accuracy of Randomized Labels, Multi-Regime Case
TABLE A.I Description of Variables in EquationEqs. (1)(1)
(1) , Equation(2)
(2)
(2) , and Equation(3)
(3)
(3)