
Figures & data
Fig. 1. Cross section of the AGR-5/6/7 northeast flux trap location in ATR.
Fig. 2. Schematic view of the AGR-5/6/7 test train rotated 90 deg from its actual orientation (in which Capsule 1 is at the bottom of the test train).
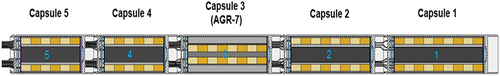
Fig. 3. Cross-sectional view of Capsules 1, 2, 4, and 5.
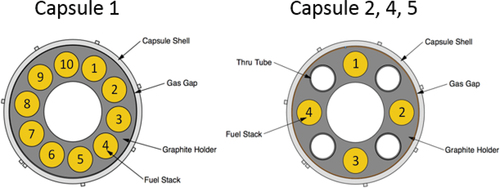
Fig. 4. AGR-5/6/7 daily average measured TC temperatures for Capsules 1 and 2 throughout several ATR cycles.
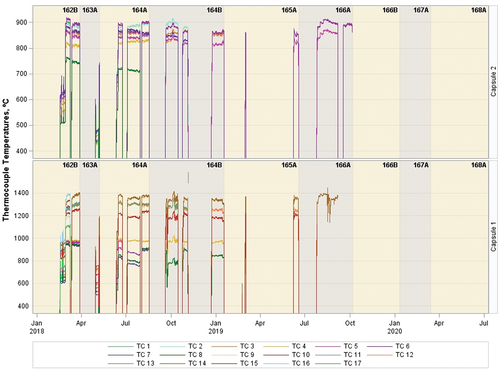
Fig. 5. Cutaway view of the finite element mesh of the entire capsule train.
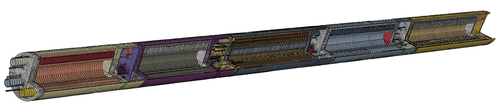
Fig. 6. Cutaway view of the finite element mesh of Capsule 1.
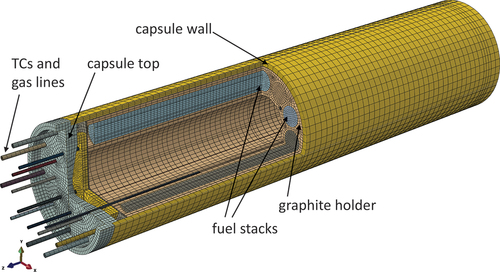
Fig. 7. Cutaway view of the finite element mesh of Capsule 2.
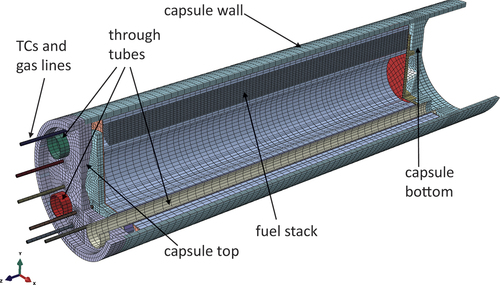
Fig. 8. Fuel compact thermal conductivity (in W/m∙K)—varying with fast neutron fluence and temperature—for Capsules 1 and 5.
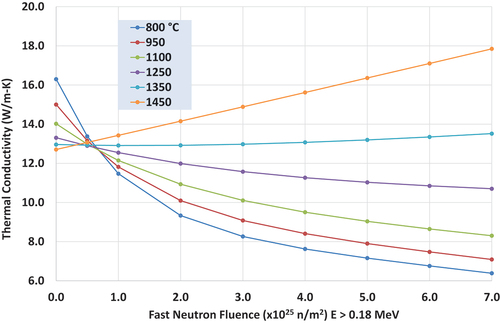
Fig. 9. Unirradiated thermal diffusivity of IG-430 nuclear-grade graphite.[Citation13]
![Fig. 9. Unirradiated thermal diffusivity of IG-430 nuclear-grade graphite.[Citation13]](/cms/asset/e0b2ed68-8928-4078-8af1-40834061c537/unse_a_2368994_f0009_oc.jpg)
Fig. 10. Graphite holder conductivity multiplier, kirr/k0, varying with temperature (in degrees Celsius) and fast neutron fluence.[Citation16]
![Fig. 10. Graphite holder conductivity multiplier, kirr/k0, varying with temperature (in degrees Celsius) and fast neutron fluence.[Citation16]](/cms/asset/59a76bc2-9537-4ade-8d35-4e505ae8af33/unse_a_2368994_f0010_oc.jpg)
Fig. 11. Graphite holder coefficient of thermal expansion multiplier, αirr/α0, varying with temperature (in degrees Celsius) and fast neutron fluence.[Citation16]
![Fig. 11. Graphite holder coefficient of thermal expansion multiplier, αirr/α0, varying with temperature (in degrees Celsius) and fast neutron fluence.[Citation16]](/cms/asset/27665036-6c16-4629-abbf-227f39d6c93e/unse_a_2368994_f0011_oc.jpg)
Fig. 12. Graphite holder thermal conductivity (in W/m∙K) of IG-430 varying with temperature (in degrees Celsius) and fast neutron fluence.
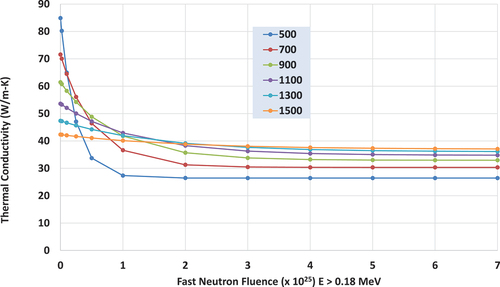
Fig. 13. Diametric change of the AGR-5/6/7 Capsule 1 and 2 graphite holders, plotted with IG-430 graphite specimens, as a function of fast neutron fluence with PIE measurements.
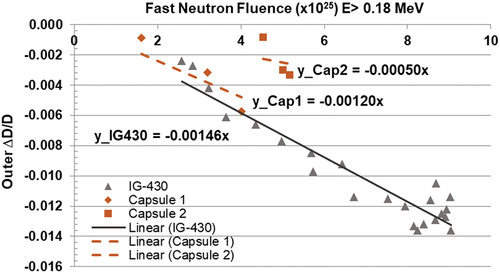
Fig. 14. Helium-neon gas mixture thermal conductivity (in mW/m∙K) varying with neon fraction and temperature (in degrees Celsius).[Citation19]
![Fig. 14. Helium-neon gas mixture thermal conductivity (in mW/m∙K) varying with neon fraction and temperature (in degrees Celsius).[Citation19]](/cms/asset/9a9aaca4-2af3-48cf-9401-79a9c5d66ae1/unse_a_2368994_f0014_oc.jpg)
Fig. 15. Compact heat rates (in W/cm3) for March 7, 2018.
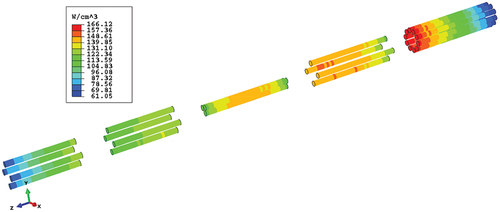
Fig. 16. Graphite holder heat rates (in W/cm3) for March 7, 2018.
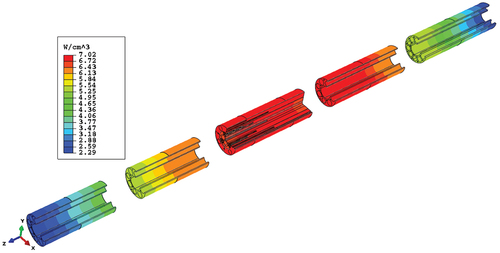
Fig. 17. Component heat rates (in W/cm3) for March 7, 2018.
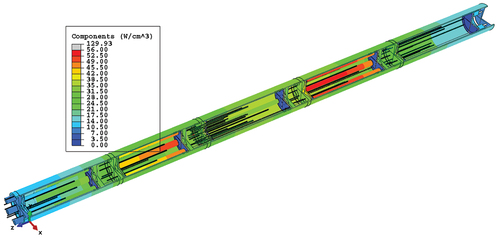
Fig. 18. Temperature (in degrees Celsius) contour plot cutaway view of Capsule 1, with the graphite holder perfectly centered.
Fig. 19. Gap calculation diagram, with capsule wall (outer circle) offset h units (x direction) and k units (y direction).
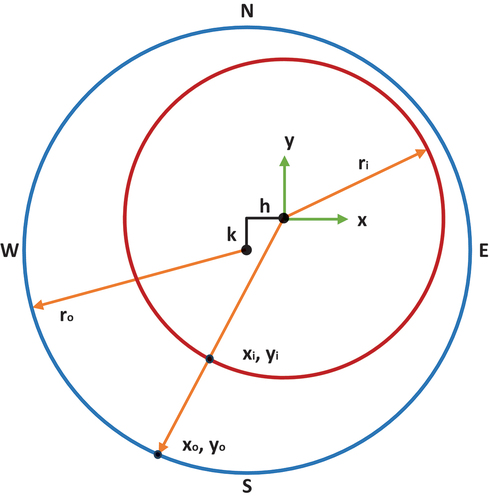
Fig. 20. Temperature (in degrees Celsius) contour plots showing a cut section in Capsule 1 at 2.35 in. from the top of graphite holder varying by an offset of 0.001 in. in eight directions, as taken on the 20th day of irradiation, March 7, 2018.
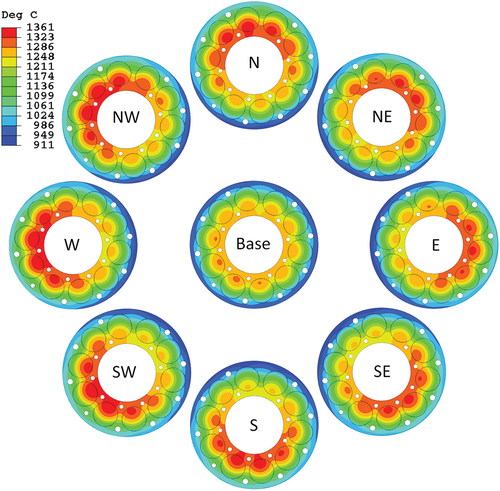
TABLE I Sixty-five Combinations of the Top and Bottom Offset Directions per Computer Run
TABLE II Results for Each of the 16 Offset Distances, the Best-Fit Direction, and the Minimum RMSE for March 3, 2018*
Fig. 21. Residuals of the 17 TCs as a function of offset direction () for the best-fit offset of t2b3.5, showing the smallest TC residual variation on March 3, 2018, to be at Step 36.
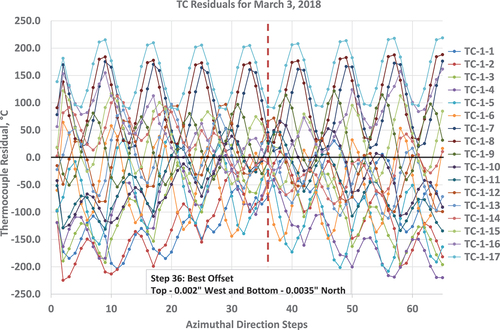
Fig. 22. Average and RMSE residuals from the 17 TCs as a function of offset direction step (), showing the best offset position for March 3, 2018, to be at Step 36.
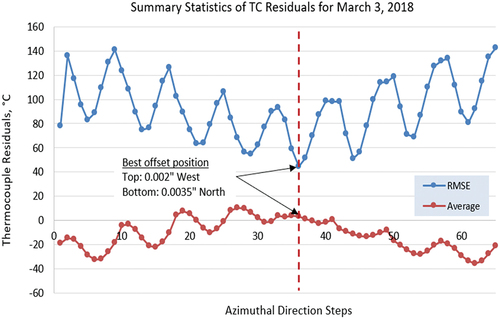
Fig. 23. Thermocouple residuals of the zero and best-fit offsets for March 3, 2018.
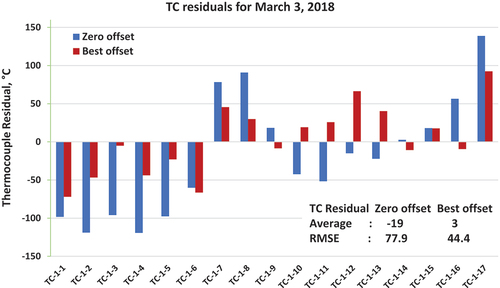
Fig. 24. Temperature (in degrees Celsius) contour plot of the one-finite-element-thick slice (level 7), in which the highest temperature occurs for March 3, 2018—the best-fit offset position being 0.002 in. top west and 0.0035 in. bottom north.
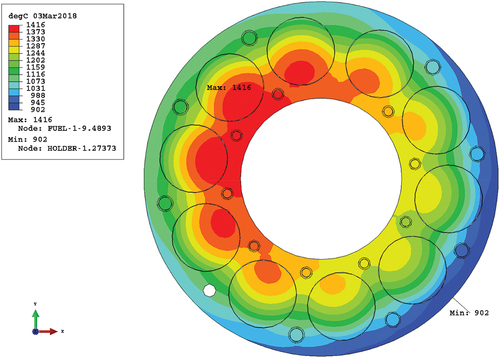
TABLE III Capsule 1 Best-Fit and Zero Offset Distance and Direction, with Minimum RMSE, for March 3, July 15, and August 12, 2018
TABLE IV Capsule 1 Fuel Compact Temperatures for the Offset Options for September 20, 2019*
Fig. 25. Temperature (in degrees Celsius) distribution along TC-1-7 (near the hottest fuel compact) from the holder top to tip for Sep 20, 2019 (166A).
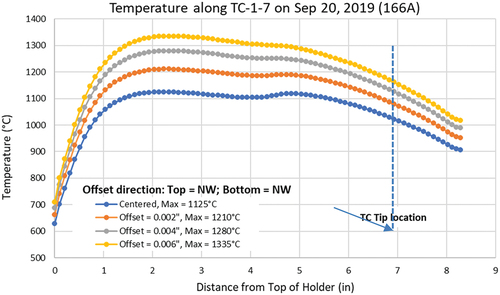
Fig. 26. Capsule 1 holder, showing the fuel stacks and major deposits.
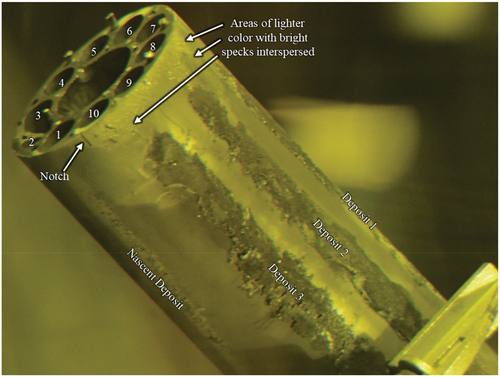
TABLE V Capsule 1 Fuel Compact Temperatures for the Zero and Best-Fit Offsets for the Four Selected Dates
TABLE VI Capsule 2 Best-Fit Options for Each of the Nine Offset Distances, Best-Fit Direction, and Minimum RMSE for March 3, 2018*
Fig. 27. Capsule 2 residuals of eight TCs as a function of offset direction () for the best-fit offset, showing the smallest variation of TC residuals to be at Step 14 for March 3, 2018.
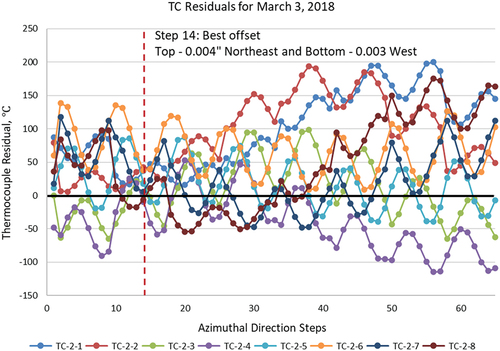
Fig. 28. Capsule 2 average and RMSE residuals from the eight TCs as a function of offset direction step (), showing the best offset position to be at Step 14 for March 3, 2018.
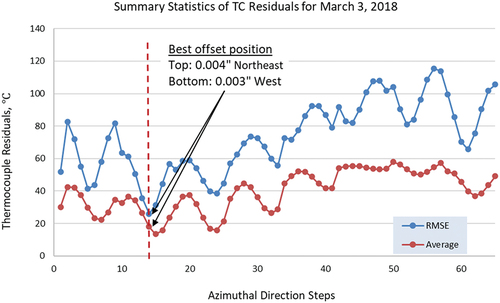
Fig. 29. Capsule 2 TC residuals of the zero and best-fit offsets for March 3, 2018.
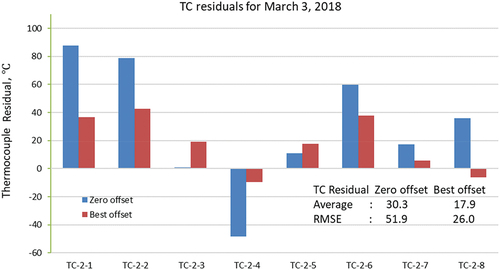
Fig. 30. Capsule 2 temperature (in degrees Celsius) contour plot of one-finite-element-thick slice (level 4) in which the highest temperature occurs for March 3, 2018, the best-fit offset position being 0.004 in. top northeast and 0.003 in. bottom west (Step 14).
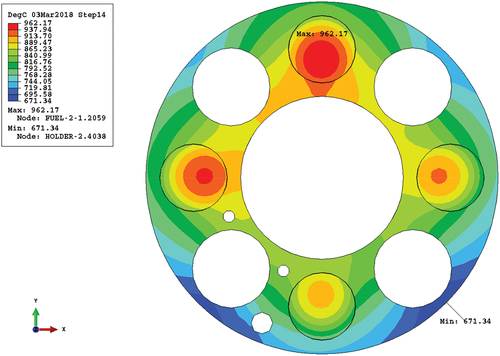
TABLE VII Summary of Capsule 2 Best-Fit Results for the First Two Dates in 2018
Fig. 31. Temperature (in degrees Celsius) contours of the fuel in Capsule 2, with a one-quarter slice taken out of each fuel stack, including the bottom Grafoil (to help with perspective), for April 20, 2020, with top and bottom offsets to the south at 0.0068 in.
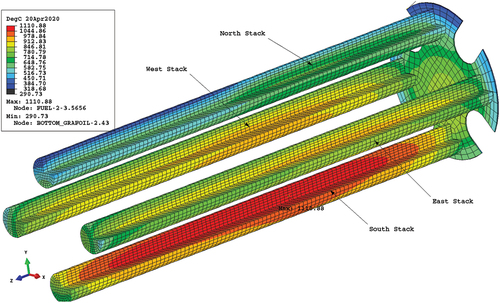
TABLE VIII Capsule 2 Fuel Compact Temperatures for the Zero and Best-Fit Offsets for Three Selected Dates