Figures & data
Figure 1. International averages of PIAAC literacy and numeracy performance across 20 countries (Austria, Belgium, Canada, Czech Republic, Denmark, Finland, France, Germany, Great Britain/North Ireland, Ireland, Italy, Japan, Korea, the Netherlands, Norway, Poland, Russia, Spain, Sweden and the United States) for 10 age cohorts.
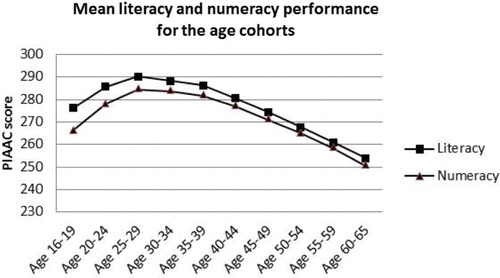
Table 1. Reading literacy performance in PIAAC 2012 and PISA for corresponding age cohorts (d-values).
Table 2. Reading literacy in PIAAC and PIRLS (d-values).
Table 3. Reading literacy performance in PIAAC and IEA RL 1991 for corresponding age cohorts (d-values).
Table 4. Reading literacy in PIAAC 2012 and IEA RL 1970 (d-values).
Table 5. Mathematics performance in PIAAC and PISA for corresponding age cohorts (d-values).
Table 6. Mathematics performance in PIAAC and TIMSS for corresponding age cohorts (d-values).
Table 7. Mathematics performance in PIAAC 2012 and older IEA studies for corresponding age cohorts (d-values).
Figure 2. Literacy results (d-values) in PIAAC for 10 age cohorts in the Nordic countries. The difference has been computed between the mean for each age cohort and each country and the international average for the age cohort, after which the difference has been standardized with the average standard deviation across countries for the age cohort.
Figure 3. Numeracy results (d-values) in PIAAC for 10 age cohorts in the Nordic countries. The difference has been computed between the mean for each age cohort and each country and the international average for the age cohort, after which the difference has been standardized with the average standard deviation across countries for the age cohort.