Figures & data
Table 1. Descriptive statistics, percentages and standard deviations for four years.
Table 2. Multilevel models and estimates for 2012, with grades as the dependent variable. Statistically significant parameter estimates (p < 0.05) are shown in bold. The share of students in independent schools in the municipality is for 2012 (the results for all years 1991–2012 can be found in the online supplementary material, Tables S1–S8).
Figure 1. Parameter estimates for the share of students in independent schools in the municipality from 1991 to 2012. Bars show the 95% confidence intervals. The three diagrams show the parameter estimates for three different models. A) Model 1 is an empty model, except for the share of students in independent schools in the municipality. The parameter estimates show that, since 2001, students’ grades were positively correlated with the share of students in independent schools in the municipality. B) In Model 2, individual variables were added. The parameter estimates for this model since 2002 also show a positive correlation between students’ grades and the share of students in independent schools in the municipality. C) In Model 3, which includes both individual variables and school composition, there was no significant correlation between students’ grades and the share of students in independent schools in the municipality.
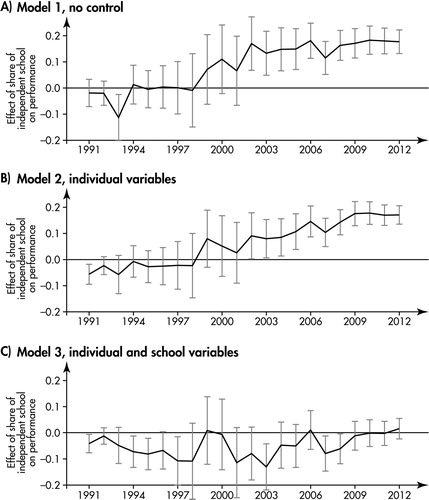
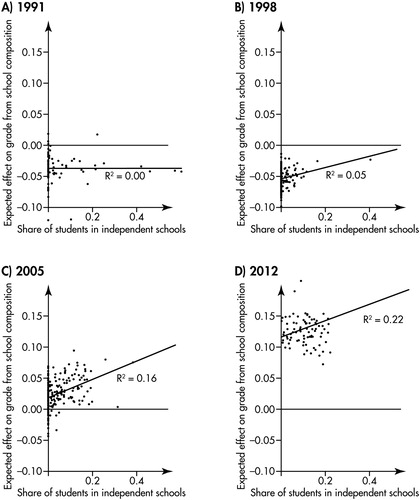
Figure 2. The expected effect on the grade that the average student experiences from the school composition in the municipality according to Model 3 and the extent to which this effect is correlated with the share of students in independent schools in the municipality for four different years. The selected four years are evenly distributed in the studied time span, and the trends between these years are continuous.