Figures & data
Figure 1. Project organization.
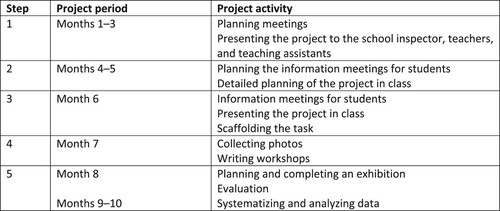
Figure 2. Model for analysis of newly arrived immigrant students’ multimodal texts.
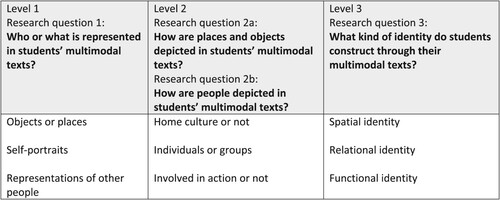
Figure 3. Percentage distribution of who and what is represented in the newly arrived immigrant students’ multimodal texts.
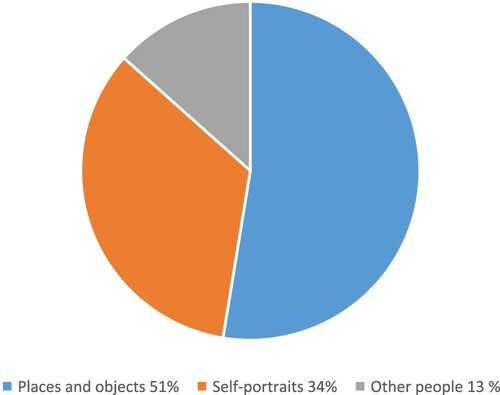
Figure 4. Distribution of various motifs in the immigrant students’ texts. Note: Although these figures are based on low numbers, they give an indication of the distribution of motifs. The integer numbers of the figures are as follows: a, 41/10; b, 17/15; c, 7/6; and d, 27/5.
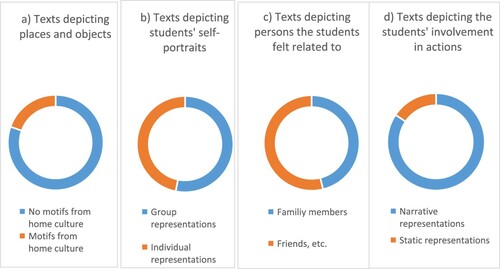
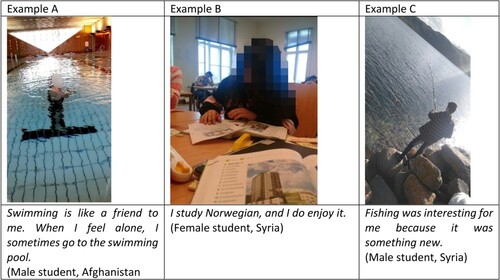
Figure 5. Texts foregrounding interior, space, and landscape.
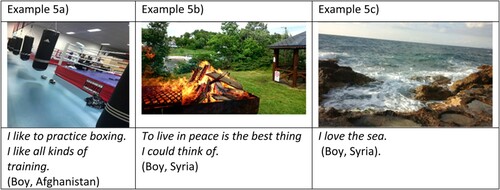
Figure 6. Texts foregrounding objects from a materialistic and globalized youth culture.
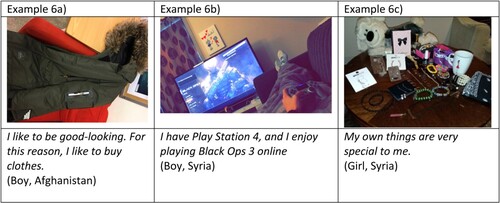
Figure 7. Texts foregrounding objects from the students’ home cultures.
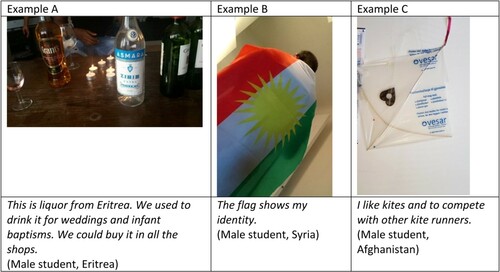
Figure 8. Texts depicting students’ self-portraits.
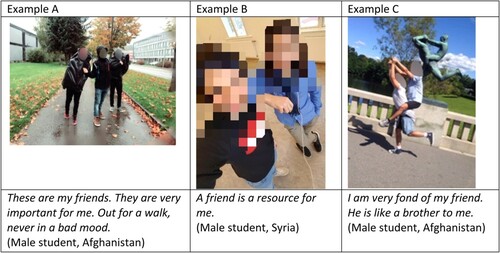
Figure 9. Texts depicting people to whom the students felt related.
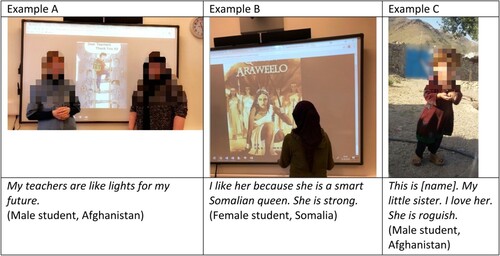
Figure 10. Texts depicting the students’ agency.