Figures & data
Figure 1. Teachers’ adaptive expertise spectrum, emphasizing both routine and innovative expertise.
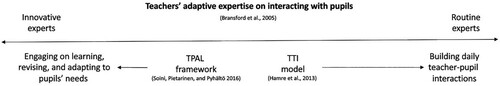
Table 1. Means, standard deviations, Cronbach's alpha, and intercorrelations among all subscales (N = 48).
Table 2. Interviewees’ profile by gender, years of experience, teacher activity, grade, interviews’ time, and TPAC and CBC means.
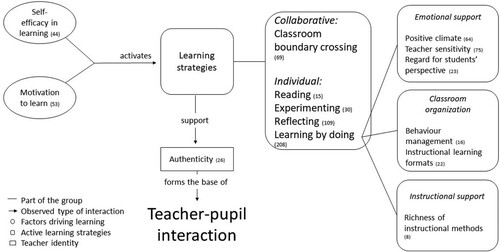
Figure 2. Teachers learn by interacting framework.