Figures & data
Table 1. Statistics from t-test of differences between schools in the 2017 cohort that participated (A) and schools that that opted out of participation (B).
Table 2. Description of the 2007 and 2017 cohorts, compared to the national average.
Figure 1. The proportion of students grouped according to the number of pages of nonfiction read in middle school in 2007 and 2017.
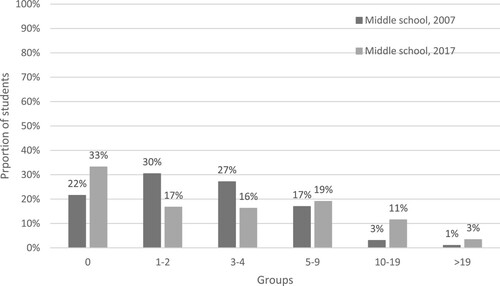
Figure 2. The proportion of students grouped according to the number of pages of nonfiction read in lower secondary school in 2007 and 2017.
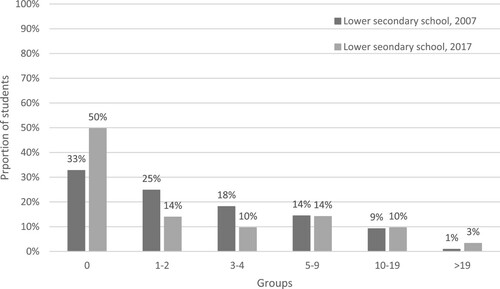
Figure 3. The proportion of students grouped according to the number of pages of fiction read in middle school in 2007 and 2017.
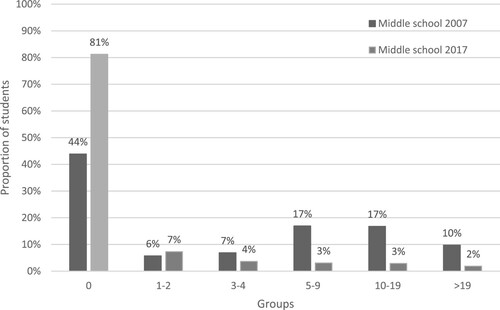
Figure 4. The proportion of students grouped according to the number of pages of fiction read in lower secondary school in 2007 and 2017.
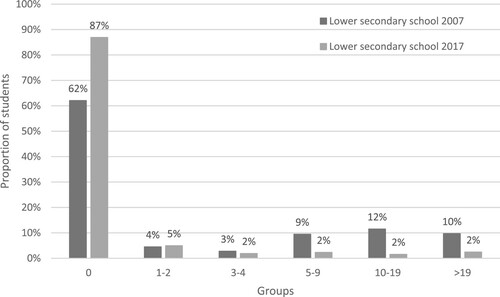
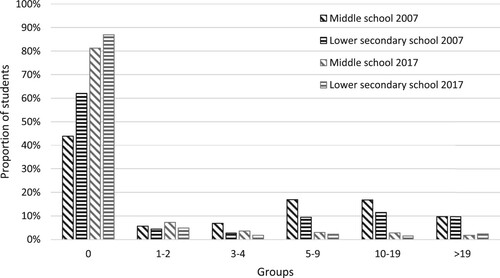
Figure 5. The proportion of students grouped according to the number of pages of nonfiction read in middle school compared to lower secondary school in 2007 and 2017.
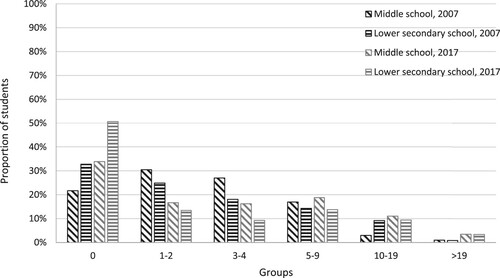
Figure 6. The proportion of students grouped according to the number of pages of fiction read in middle school compared to lower secondary school in 2007 and 2017.