
Figures & data
Table 1. Variable Frequencies, Means, Standard Deviations, Intraclass Correlations, and Bivariate Correlations Between School Climate and Truancy
Table 2. Model fit indices
Table 3. Sensitivity analyses
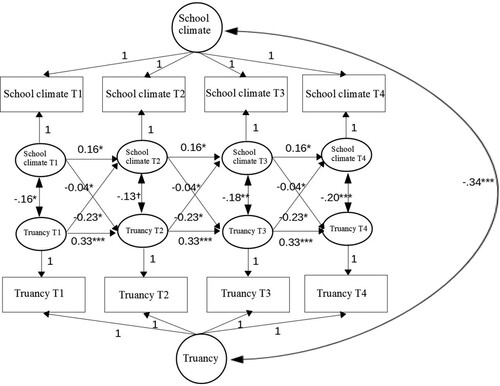
Figure 1. Reciprocal longitudinal cross-lagged associations (unstandardized coefficients) between school climate and truancy. Note. T1 = Grade 6 fall, T2 = Grade 7 fall, T3 = Grade 7 spring, T4 = Grade 9 fall. ***p < .001, **p < .01, *p < .05, †p = .051. Circles represent between-person variance (random intercepts), ovals within-person variance, and rectangles observed variables. Observed variables’ residual variances were fixed at 0. Two-headed arrows represent correlations. Random intercepts and T1-T4 within-person variances (all p < .001) are not diagrammed.
Data availability statement
No data is available