Figures & data
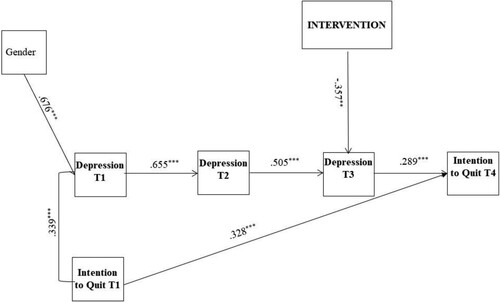
Figure 1. Flowchart of participants.
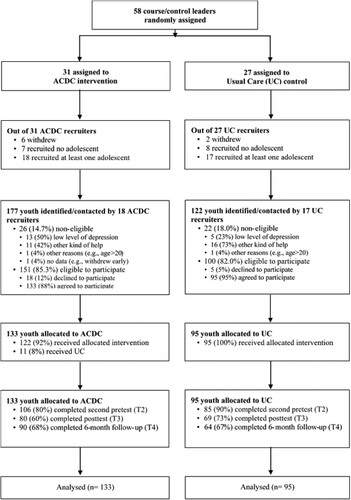
Table 1. Descriptive statistics for the intervention (ACDC) and control group (UC) measures.
Table 2. Intercorrelations among variables for the overall sample (N = 228).
Figure 2. Path diagram of the longitudinal effect of the intervention on six-month follow-up intention to quit as a result of depression at post-test. Gender = Males coded 1 and females coded 2. Intervention = UC control was coded 0 and ACDC intervention 1. T1 = pretest, T2 = second pretest, T3 = post-test, and T4 = six-month follow-up. Standardized parameter estimates are reported only for the significant paths of the covariates. **p < .01, ***p < .001.