Figures & data
Figs 1, 2. Seasonal cycle of environmental parameters in Roskilde Fjord during the study period.
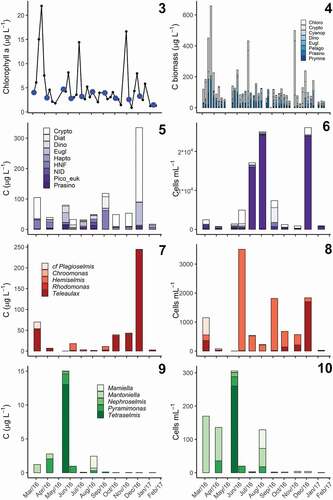
Figs 3–10. Seasonal variation in phytoplankton community composition in Roskilde Fjord.
Figs 11–27. Examples of identified organisms in Roskilde Fjord. All micrographs are LM, except Fig. 20, which is SEM. Scale bars = 5 µm.
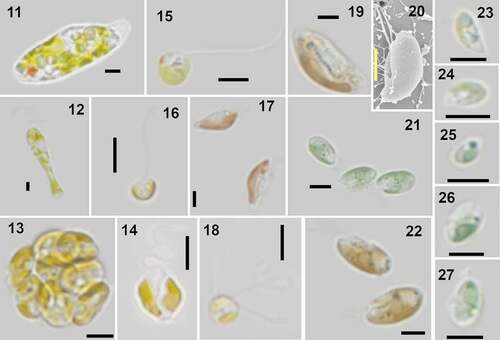
Table 1. Flagellates identified to species level, the month in which they were isolated, strain code, techniques used for identification, and GenBank accession number
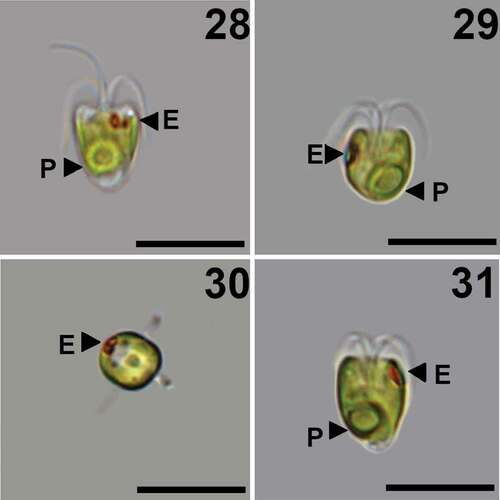
Figs 28–31. Pyramimonas octopora sp. nov., LM. Scale bars = 10 µm.
Figs 32–42. Pyramimonas octopora sp. nov., TEM. Figures 32–34, 36–41 are from thin sections; Figs 35, 42 are from whole mount preparations stained with uranyl acetate. All scale bars = 200 nm, except for Figs 32, 34 and 36 in which the scale bars = 1 µm.
Figs 43–45. Diagrammatic representation of the most characteristic scales of Pyramimonas octopora sp. nov. Drawings by Nikolaj Toftemark Nielsen.
Fig. 46. Phylogenetic analysis of Pyramimonas spp based on sequences of SSU rDNA. Bootstrap values supporting the branches are given at each node as estimated by different methods (Neighbour Joining NJ/Maximum Parsimony MP/Maximum Likelihood ML).