Figures & data
Figure 1 Educational composition of the population in 13 European countries, women born 1916–65 Source: Cohort Fertility and Education database (www.cfe-database.org).
Figure 2 Proportion of childless women by level of education in 13 European countries, women born 1916–65Source: As for .
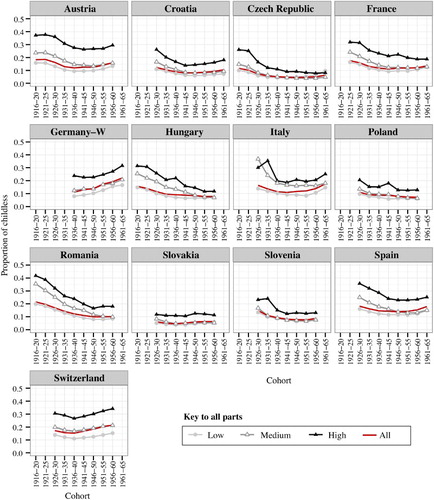
Figure 3 Relative difference in childlessness levels between low-/high- and medium-educated women, in 13 countries of Eastern and Western Europe, women born 1916–65Source: As for .
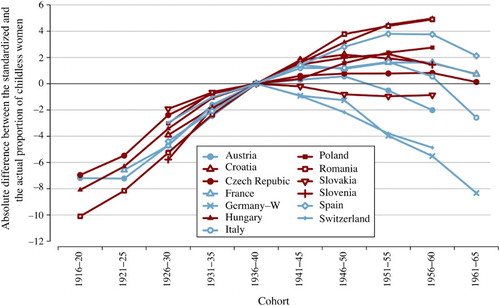
Figure 4 Effect of change in educational structure on childlessness (direct standardization, structure of women by education kept constant, see equations (2a) and (3); reference cohort: 1936–40), 13 European countries, women born 1916–65Source: As for .
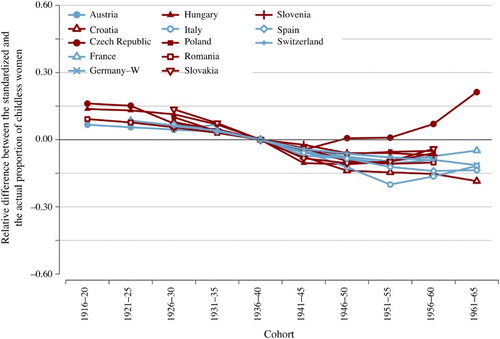
Figure 5 Effect of change in childlessness rates within educational groups on the overall level of childlessness (indirect standardization, proportion of childless women within educational groups kept constant, see equations (2b) and (3); reference cohort: 1936–40), 13 European countries, women born 1916–65Source: As for .
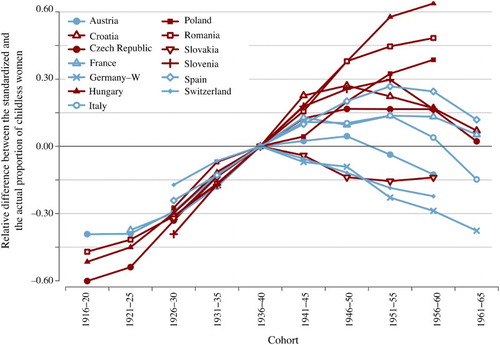
Figure A1 Relative difference in childlessness levels between high- and low-educated women, 13 countries in Eastern and Western Europe, women born 1916–65
Source: As for .
Figure A2 Effect of the change in educational structure on childlessness (direct standardization, structure of women by education kept constant, see equations (2a) and (3); reference cohort: 1936–40), 13 countries in Eastern and Western Europe, women born 1916–65
Source: As for .
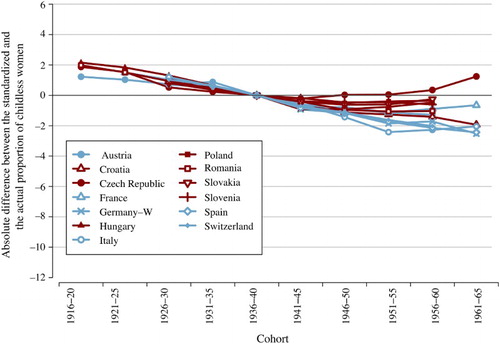
Figure A3 Effect of the change in childlessness rates within educational groups on the overall level of childlessness (indirect standardization, proportion of childless women within educational groups kept constant, see equations (2a) and (3); reference cohort: 1936–40), 13 countries in Eastern and Western Europe, women born 1916–65
Source: As for .