
Figures & data
Table 1 Descriptive statistics for analysis population of Swedish men and women born 1938–72
Table 2 Distribution of men and women in Sweden across sibling group sizes by cohort (per cent) and infant mortality (number of deaths per 100,000 births)
Table 3 Correlation of twin births with sibling group size according to birth order of twins
Table 4 Results: sibling group size and mortality among Swedish men born 1938–72, based on Gompertz shared frailty hazard model analysis
Figure 1 The relative risk of mortality by sibling group size among men born in Sweden from 1938 to 1972
Note: Bars indicate 95 per cent confidence intervals.Source: As for .
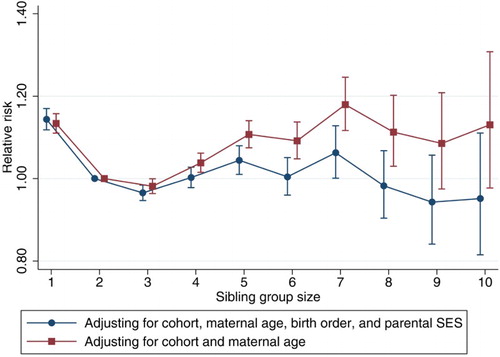
Table 5 Results: sibling group size and mortality among Swedish women born 1938–72, based on Gompertz shared frailty hazard model analysis
Figure 2 The relative risk of mortality by sibling group size among women born in Sweden from 1938 to 1972
Note: Bars indicate 95 per cent confidence intervals. Source: As for .
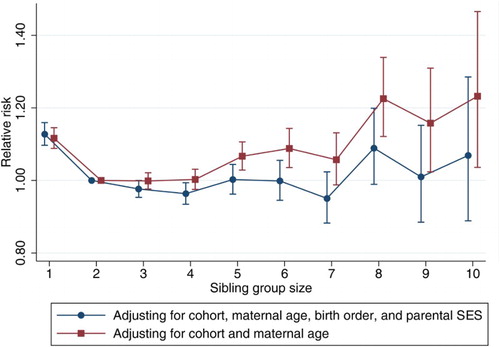
Figure 3 The relative risk of cause-specific mortality by sibling group size among men born in Sweden from 1938 to 1972
Notes: Estimates based on survival analyses controlling for cohort, maternal age, birth order, and parental SES. Bars indicate 95 per cent confidence intervals. Results for sibling group sizes 7–10 not displayed. Source: As for .
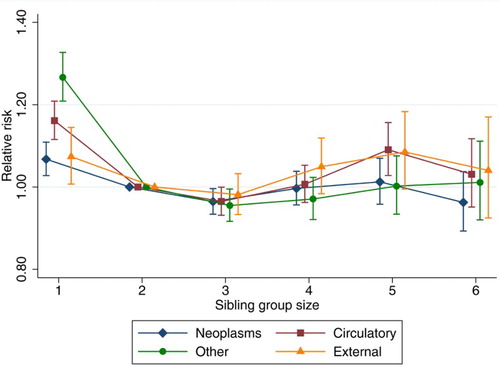
Figure 4 The relative risk of cause-specific mortality by sibling group size among women born in Sweden from 1938 to 1972
Notes: Estimates based on survival analyses controlling for cohort, maternal age, birth order, and parental SES. Bars indicate 95 per cent confidence intervals. Results for sibling group sizes 7–10 not displayed. Source: As for .
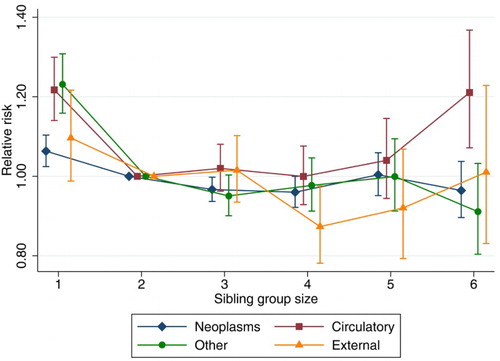
Figure 5 The relative risk of all-cause mortality by sibling group size according to the sex of siblings, for people born in Sweden from 1938 to 1972
Notes: Estimates based on survival analyses controlling for cohort, maternal age, birth order, and parental SES. Bars indicate 95 per cent confidence intervals. Results for sibling group sizes 7–10 not displayed. Source: As for .
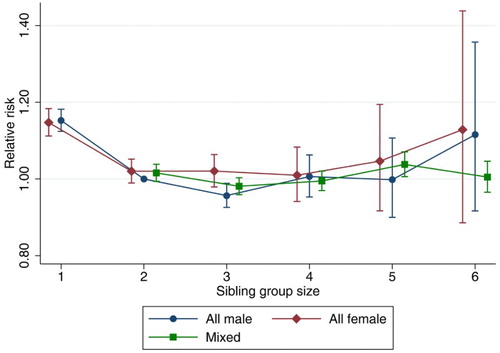
Table 6 Results: birth of subsequent twin siblings and mortality among first-, second-, third-, and fourth-born Swedish men born 1938–72, based on Gompertz hazard model analysis
Table 7 Results: birth of subsequent twin siblings and mortality among first-, second-, third-, and fourth-born Swedish women born 1938–72, based on Gompertz hazard model analysis
Supplemental material