
Figures & data
Figure 1 Example transition event generation and execution process in ML3 with several steps (from top to bottom). The current model state is denoted in blue(s). Orange(e) events are scheduled (stochastically or deterministically) and subject to stochastic race
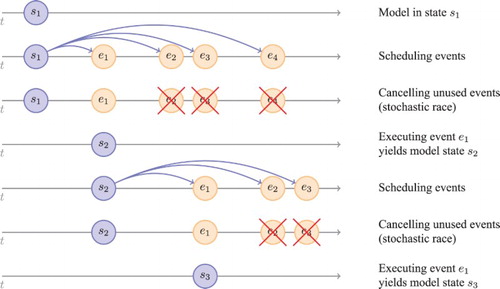
Figure 2 Possible transitions between different states in the migration decision model
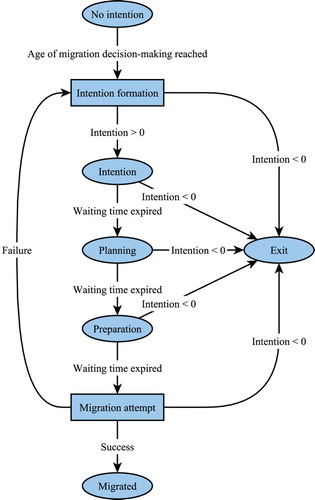
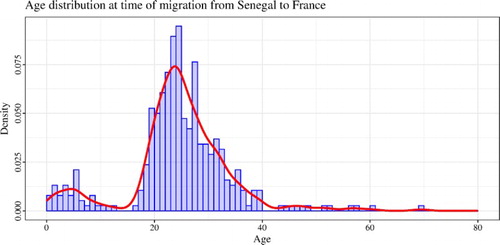
Figure 3 Distribution of ages at migration to the host country from a single simulation run. In this configuration, each person starts to consider migration at a different age drawn from a normal distribution (see Klabunde et al. Citation2017 for details)
Supplemental material