Figures & data
Figure 1 Trends in the proportion of births with unknown paternal age, Sweden (1968–2014), US (1969–2015), Spain (1975–2014), and Estonia (1989–2013)
Source: Statistics Sweden, National Bureau of Economic Research, Spanish Statistical Office, Statistics Estonia, Human Mortality Database; own calculations.
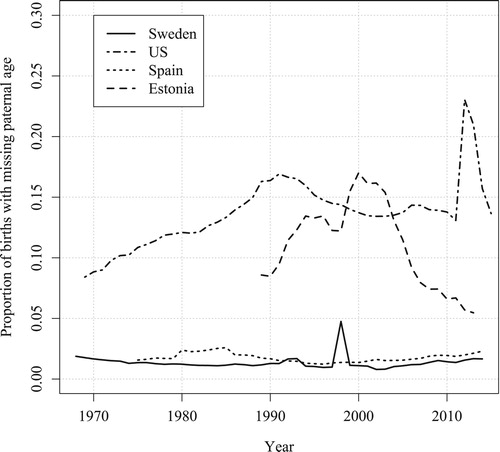
Figure 2 Absolute bias of the men’s total fertility rate (MTFR) in MTFR points, based on the unconditional approach to estimating paternal age, by age shift and proportion missing; simulations for Sweden, 2014
Source: Own calculations.
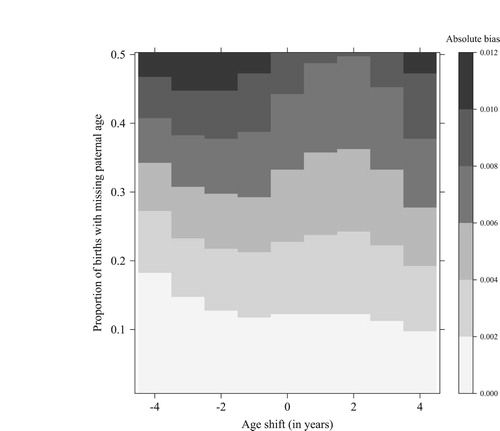
Figure 3 Absolute bias of the men’s total fertility rate (MTFR) in MTFR points, based on the conditional approach to estimating paternal age, by age shift and proportion missing; simulations for Sweden, 2014
Source: Own calculations.
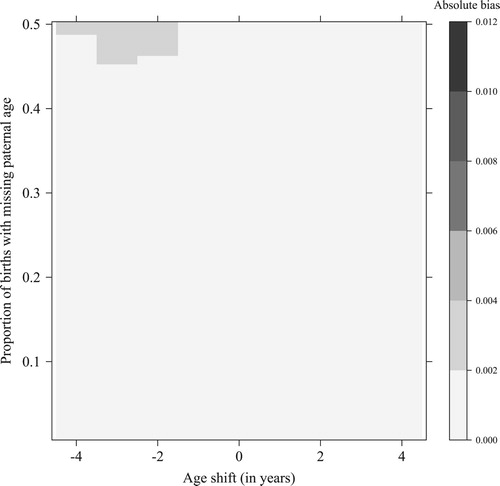
Figure 4 Absolute bias of the paternal mean age at childbirth (PMAC), based on the unconditional approach to estimating paternal age, by age shift and proportion missing; simulations for Sweden, 2014
Source: Own calculations.
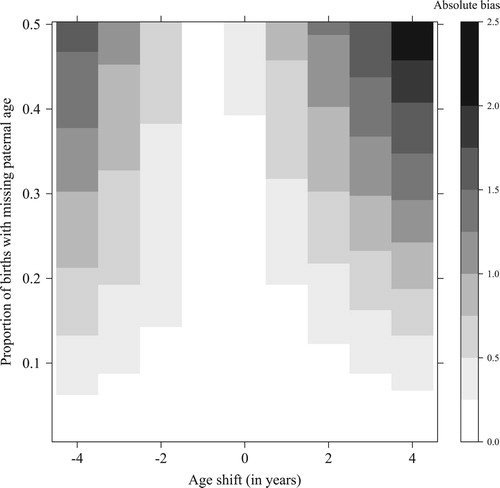
Figure 5 Absolute bias of the paternal mean age at childbirth (PMAC), based on the conditional approach to estimating paternal age, by age shift and proportion missing; simulations for Sweden, 2014
Source: Own calculations.
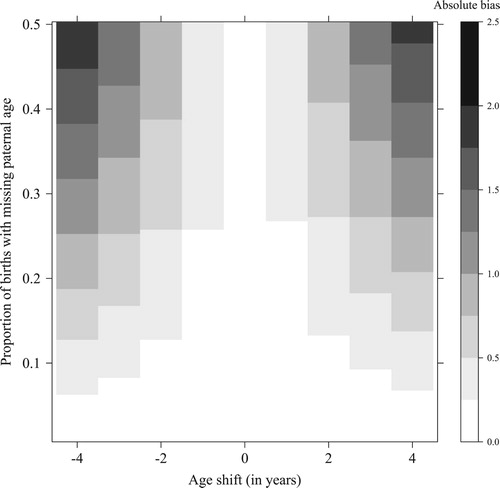
Table 1 Proportion of simulations in which the conditional approach for estimating paternal age at childbirth outperforms the unconditional approach; by country and total (percentages)
Figure A1 Proportion of missing values for age of father conditional on age of mother, Sweden 2014
Notes: Empirical data (solid line) and upscaled distributions (dotted and dashed lines). For some of the youngest and oldest ages, the 90 per cent threshold was reached and the proportion of missing values was not further increased. Source: Statistics Sweden; own calculations.
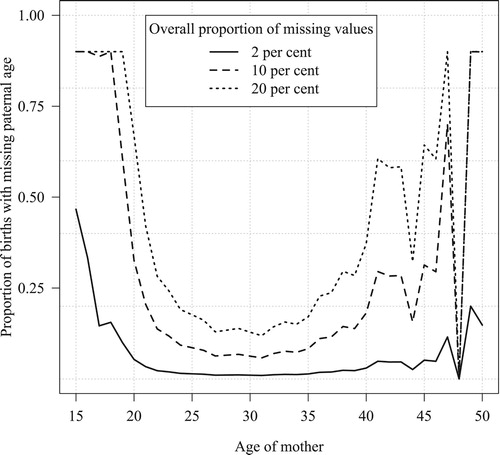
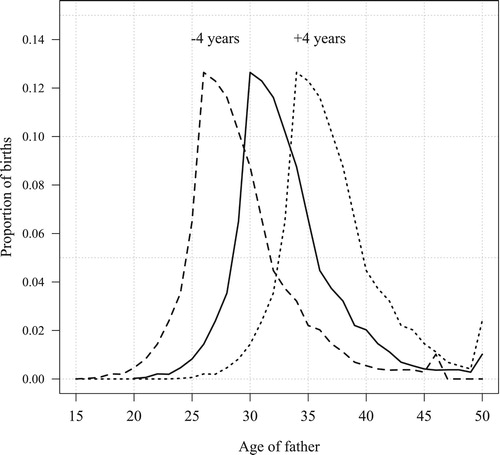
Figure A2 Distribution of age of father conditional on mother being aged 30, Sweden 2014
Notes: Original distribution (solid line) and age-shifted distributions (dotted and dashed lines). Source: Statistics Sweden; own calculations.