Figures & data
Figure 1 Graphical representation of the structural model on education, cognitive ability, and cause-specific mortality
Notes: Latent cognitive ability, θ, influences the individual education attained, E, and the (potential) cause-specific hazard, , for each cause, c, and each education level, E = e. Educational attainment and the cause-specific hazard also depend on observed covariates XE or Xc. The IQ measurement, IQ, depends on the latent cognitive ability and on observed covariates XIQ. Note that XE, Xc, and XIQ may overlap or even be the same.
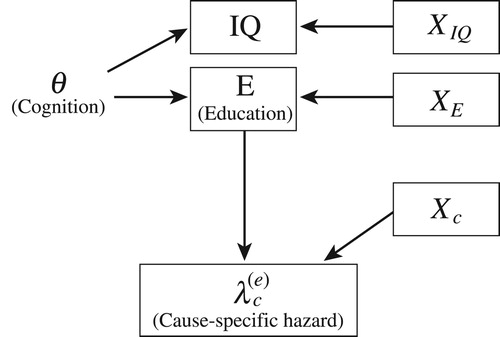
Table 1 Sample characteristics, Swedish conscripts born 1951–60 (N = 446,545)
Figure 2 Cumulative incidence curves by level of education for (a) neoplasms, (b) cardiovascular diseases, (c) external causes, and (d) ‘other’/unknown causes; Swedish conscripts born 1951–60
Source: Authors’ calculations based on Swedish Military Service Conscription Register linked to Swedish administrative registers.
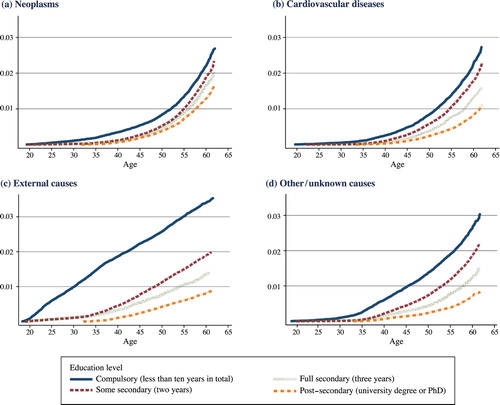
Table 2 Cox proportional hazards odds ratios of education on cause-specific mortality, Swedish conscripts born 1951–60, ages 18–63
Table 3 Months lost and educational gain (at ages 18–63) by cause of death and level of education, structural model, Swedish conscripts born 1951–60
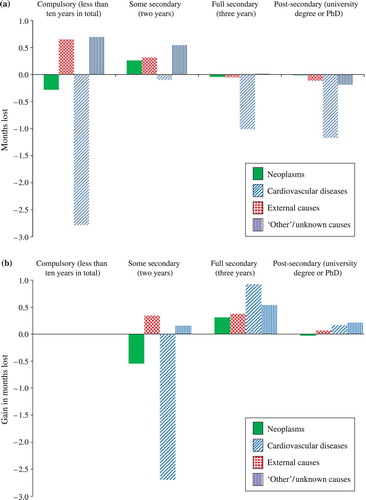
Figure 3 (a) Months lost and (b) educational gains (at ages 18–63): differences between Cox model and structural model, Swedish conscripts born 1951–60
Notes: (a) The difference in months lost by education level for the Cox model compared with the structural model, where a positive value indicates that the Cox model overestimates the months lost. (b) The difference between the Cox model and the structural model in the implied educational gains in reducing the number of months lost by improving the education level, where a positive value indicates that the Cox model overestimates this educational gain. See for the results from the structural model.Source: As for .