Figures & data
Figure 1 Annual life expectancy at birth in Scotland from 1855 to 20161, by period and urban–rural categories2 from 1861 to 1910, and best-practice trend3, by sex
1We include all the values of life expectancy at birth for Scotland available in the Human Mortality Database (HMD), to provide a better idea of the particularities of our study period 1861–1910 (bounded by the black dashed vertical lines in the figure). 2The points show estimates of life expectancy at birth for different urban–rural categories at the middle of each defined subperiod (see ‘Data’ section). The original categories in the sources were regrouped as shown by the legend, thus: Principal and large towns (urban); Small towns (semi-urban); and Rural. Note that before 1871, the Rural category includes the small towns with fewer than 10,000 inhabitants. 3Life expectancy at birth among the best-practice (record-holding) populations, based on the rates of increase reported in Oeppen and Vaupel (Citation2002). Source: 7th to 56th Detailed Annual Reports of the Registrar General for Scotland; the HMD; Oeppen and Vaupel (Citation2002).
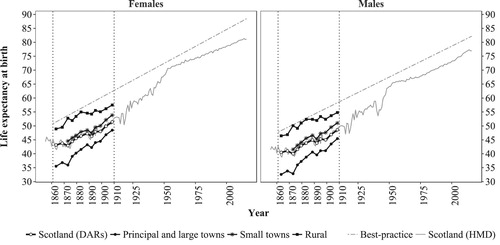
Figure 2 (a) Annual estimates of population size at mid-year, 1858–1910, by district type in Scotland1. (b) Estimates of the proportion of the total population living in cities of 10,000 or more inhabitants, Scotland, 1500–19102
1The bars represent annual estimates of mid-year population by urban–rural category, as reported in each Detailed Annual Report (DAR) from 1858 to 1910. The original urban and rural categories in the sources were retained. There was a change in these categories in 1871 (see ‘Data’ section). In an effort to preserve some continuity with the population data before that change, the 17th DAR provided estimates of population size for each one of the new categories for the year 1861 only (see RGS Citation1875, Table II, p. x). 2The points from the DARs are every tenth year from 1860 to 1910. Source: 4th to 56th Detailed Annual Reports of the Registrar General for Scotland; Whyte (Citation1995).
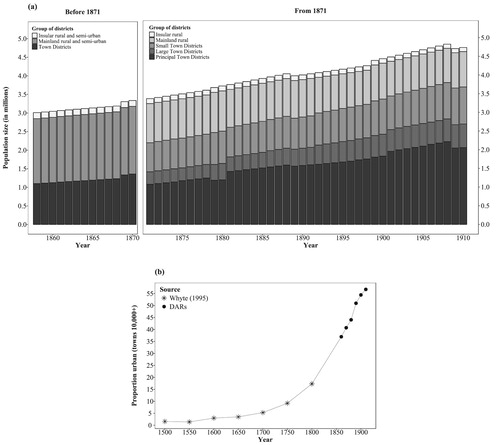
Table 1 Number of towns with 10,000 or more inhabitants, by period and category,1 Scotland 1861–70 to 1901–10
Table 2 Notation1
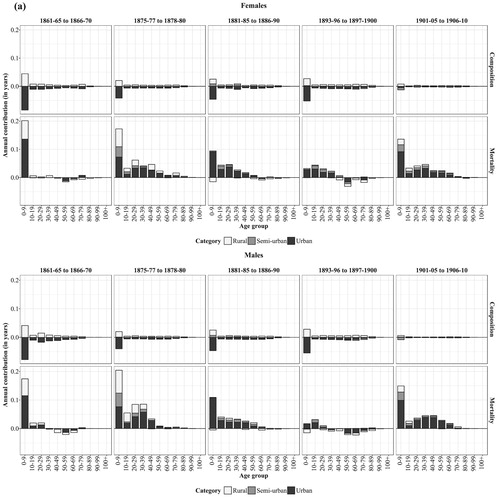
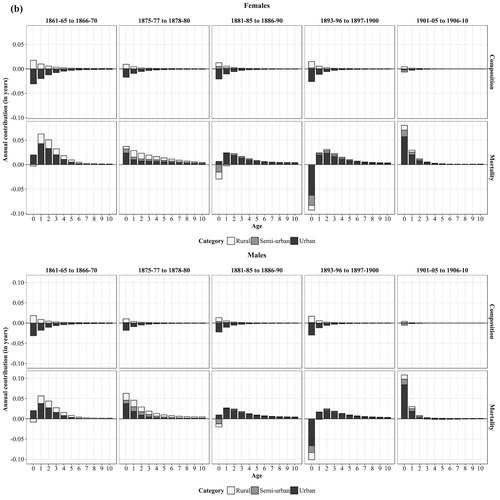
Table 3 Changes in life expectancy at birth between selected periods, and total contributions of changes in mortality and in urban–rural population composition, by sex, Scotland 1861–65 to 1906–10
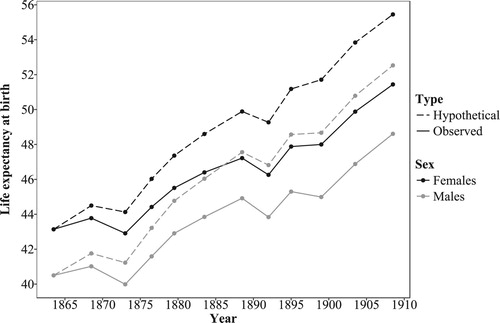
Figure 3 Levels of life expectancy at birth in Scotland, based on rates of change with (‘observed’) and without (‘hypothetical’) the urbanization penalty, by sex, 1861–65 to 1906–101
1Points located at the middle of each time interval as defined in Table A4 (supplementary material). Source: Computed life tables based on data from the Detailed Annual Reports (DARs) of the Registrar General for Scotland (7th to 56th DARs) and the Human Mortality Database; authors’ decomposition results; and Appendix 4 in the supplementary material (Table A4).