
Figures & data
Table 1 Descriptive statistics for SOEP sample, Germany 2008–12 (n = 34,495 person-years)
Figure 1 Annual probability of childbirth by DSL access and age: highly educated individuals, Germany 2008–12
Source: Authors’ analysis of SOEP data.
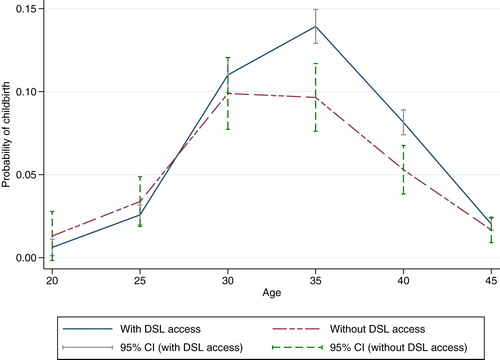
Figure 2 Annual probability of childbirth by DSL access and age: less-educated individuals, Germany 2008–12
Source: As for .
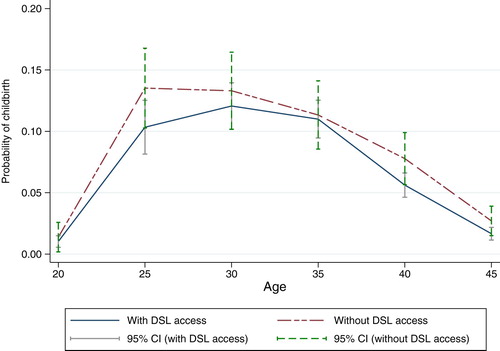
Figure 3 Proportion of SOEP households with DSL access by county (Kreis): Germany 2008, 2010, and 2012
Notes: Darker areas correspond to higher levels of DSL access in the corresponding county (Kreis).
Source: As for .
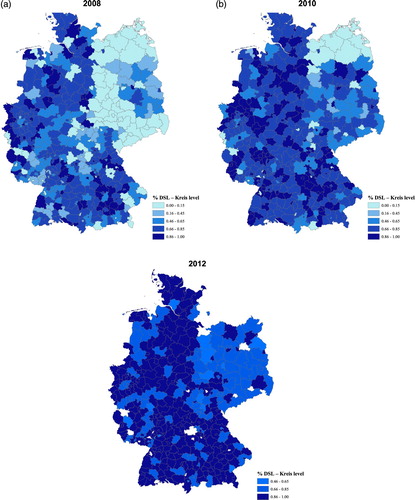
Figure 4 Total fertility by county (Kreis): Germany 2008, 2010, and 2012
Notes: Darker areas correspond to higher levels of fertility in the corresponding county (Kreis).
Source: INKAR administrative records.
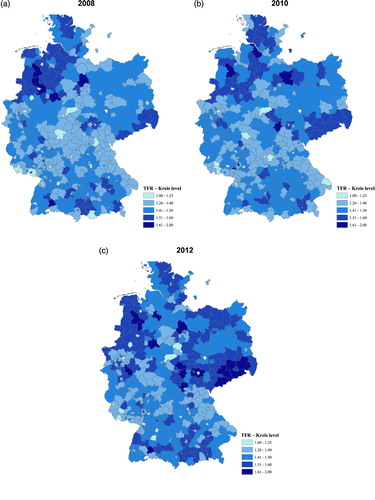
Table 2 Effects of access to broadband on fertility by age group and sex, Germany 2008–12
Table 3 Effects of broadband on fertility by education and sex: individuals aged 25–45, Germany 2008–12
Table 4 County-level analysis: first-difference model of effects of broadband on fertility, Germany 1999–2008
Table 5 Potential mechanisms for effect of broadband on fertility: highly educated women aged 25–45, Germany 2008–12
Supplemental material