Figures & data
Table 1 Person-years, deaths, and mortality rates by sex and treatment period, ages 15–49, Uganda 2000–14
Figure 1 Life-years lived by (a) HIV-negative individuals, (b) HIV-positive individuals, and (c) individuals with unknown HIV status, compared with the population as a whole; and (d) population-wide life-years lived and lost to HIV; all between ages 15 and 50, by sex and calendar year, Uganda 2000–14
Source: Authors’ calculations from RCCS data.
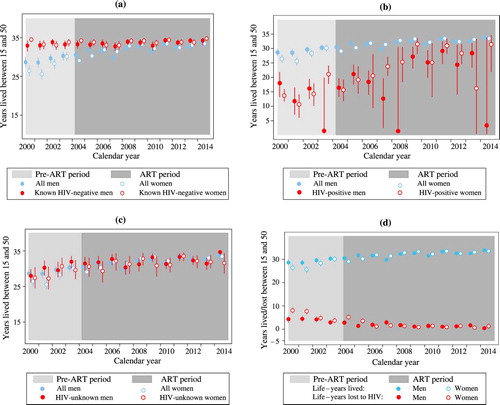
Figure 2 Trends in the total number of deaths among PLHIV (left-hand axis) and all-cause mortality rates for PLHIV (right-hand axis), by treatment status, Uganda 2000–14
Source: As for .
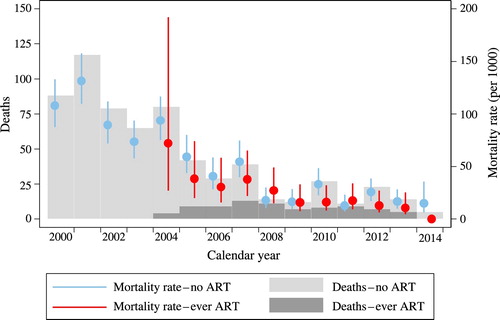
Table 2 All-cause mortality in HIV-positive individuals: hazard ratios and 95 per cent confidence intervals (Weibull regression), Uganda 2000–14
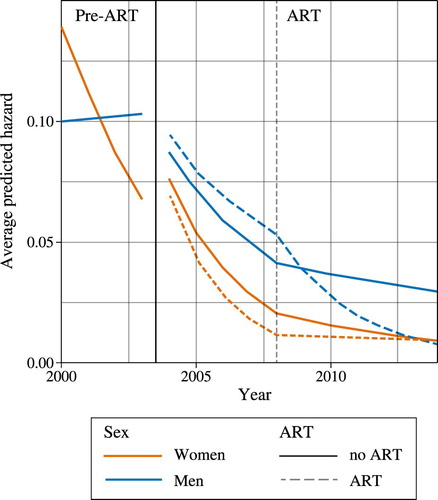
Figure A1 Model-predicted hazard of mortality for HIV-positive individuals by sex, calendar year, and ART status, Uganda 2000–14
Note: Dashed vertical line at 2008 represents the spline inflection in the model. Source: As for .