Figures & data
Figure 1 Distribution of deaths attributed to external causes in Mexico vs. the benchmark, showing decomposition effects: males, 2010–14
Notes: Solid and dotted lines represent the number of life table deaths attributed to external causes of death in Mexico and the developed world benchmark, respectively, for the period 2010–14. The shaded grey area depicts the discrepancies between the two mortality schedules by age. Each panel illustrates a different decomposition effect, as shown by the arrows. Source: Authors’ calculations using data from UN World Population Prospects, WHO Mortality Database, and Human Mortality Database.
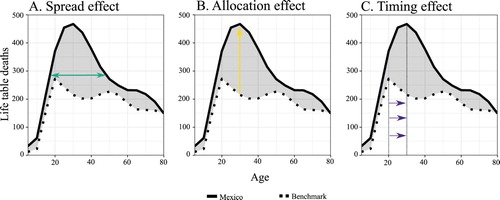
Table 1 Life expectancies and standard deviations for Latin America and the Caribbean, and comparisons with a developed world benchmark: females, various years
Table 2 Life expectancies and standard deviations for Latin America and the Caribbean, and comparisons with a developed world benchmark: males, various years
Figure 2 Scatterplot of life expectancy and standard deviation differences between Latin American and Caribbean countries and the benchmark, plus benchmark trajectories: (A) females and (B) males, 2000–04, 2005–09, and 2010–14
Notes: The main panels display the differences from the developed world benchmark for females (A1) and males (B1) in LAC countries. Inset panels A2 and B2 show the trajectories of the developed world benchmark for females and males, respectively. Data for Bolivia and Haiti are only available for the period 2000–04. Source: As for .
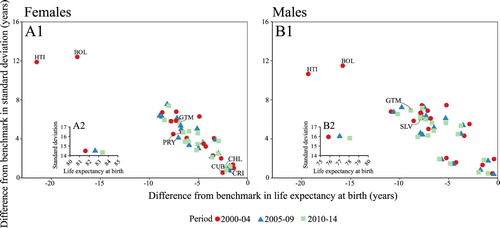
Figure 3 Decomposition of standard deviation differences for selected Latin American and Caribbean countries: females, 2000–04, 2005–09, and 2010–14
Notes: Total differences in standard deviation between the benchmark and LAC countries for females can be found in . Source: As for .
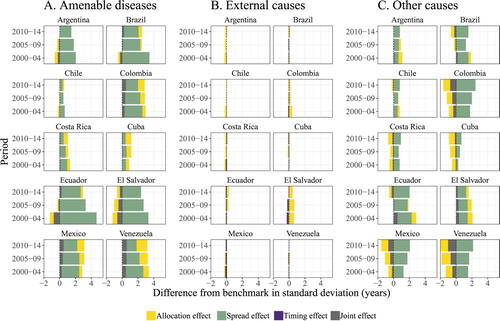
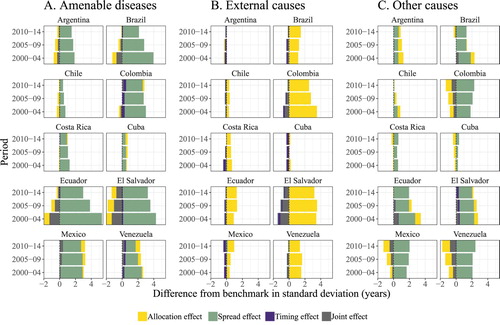
Figure 4 Decomposition of standard deviation differences for selected Latin American and Caribbean countries: males, 2000–04, 2005–09, and 2010–14
Notes: Total differences in standard deviation between the benchmark and LAC countries for males can be found in . Source: As for .