
Figures & data
Figure 1 Overview of ELSA data structure and conceptual linkages
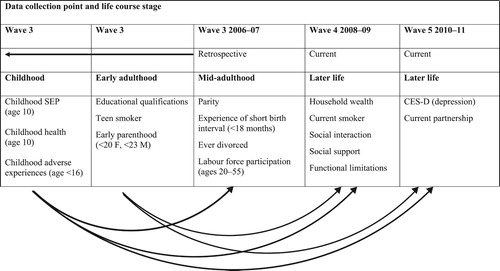
Table 1 Distribution of sample by variables used in the analysis, by sex and age group
Table 2 Direct associations (β from logistic regression) between fertility and other life course stressors and having three or more depressive symptoms (CES-D) in later life
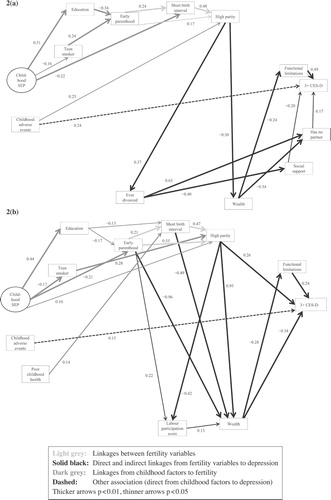
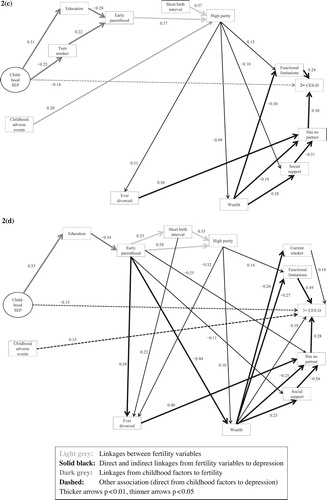
Table 3 Standardized direct, indirect, and total effects of fertility and childhood variables on depressive symptoms (CES-D) in later life: men and women aged 55–64 and 65+
Supplemental material