Figures & data
Figure 1 Time trends in generalized trust for Italian regions according to the European Values Survey
Notes: The graph shows the time trends (dashed lines) in the proportion of people trusting others in each Italian region. Note that the years with available data are not evenly spaced. The proportion is calculated using all the waves available for Italy within the EVS. Solid straight lines represent the linear fit for each region. Source: EVS 1990, 1999, 2005, and 2009.
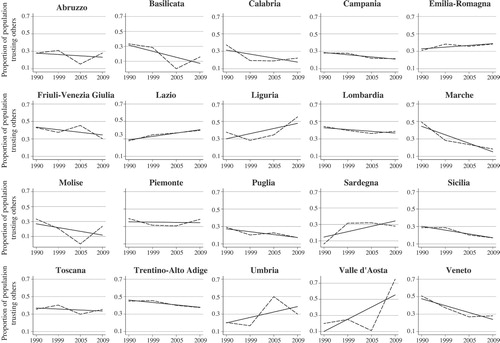
Figure 2 Time trends in generalized trust for Italian regions according to the European Social Survey
Notes: The graph shows the time trends (dashed lines) in the proportion of people trusting others in each Italian region. Note that the years with available data are not evenly spaced. The proportion is calculated using all the waves available for Italy within the ESS. Solid straight lines represent the linear fit for each region. Data for Molise are missing, as are as those for Trentino-Alto Adige for 2002 and Valle d’Aosta for 2004 and 2012. Source: ESS 2002, 2004, 2012, and 2016.
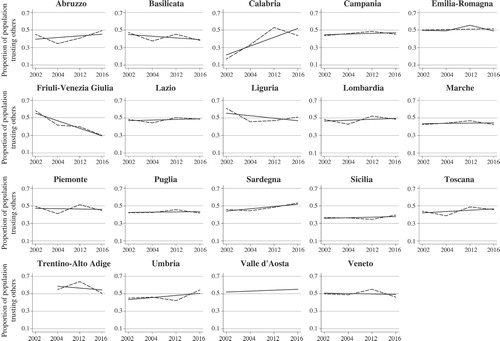
Figure 3 Density distributions of the TFR and generalized social trust across Italian provinces
Notes: The graph shows in panel (a) the density distribution of the average TFR in the period 2008–13 and in panel (b) the density distribution of generalized social trust in 1990. The continuous curve represents the hypothetical normal density distribution, while the dashed curve shows the actual k-density distribution. Source: EVS 1990, Nannicini (Citation2013), and Istat.
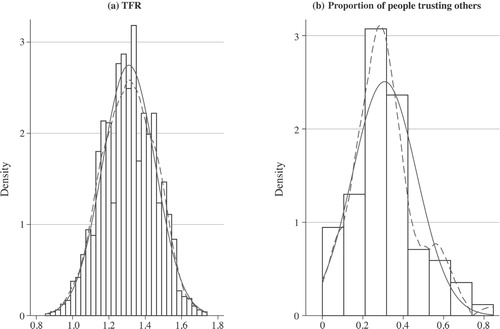
Figure 4 Geographical distribution of TFR and generalized social trust across Italian provinces
Notes: The map shows in panel (a) the quartile of the distribution of the average TFR at the provincial level during the period 2008–13 while in panel (b) the quartile of the distribution of trust at the provincial level in 1990. The more intense the shading colour of a province, the higher the quartile it belongs to. Provinces where data about generalized social trust are unavailable are coloured black in the maps. Source: As for .
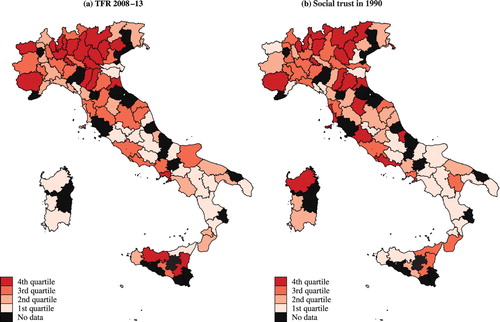
Table 1 Summary statistics of dependent and explanatory variables for Italian provinces 2004–13
Figure 5 The impact of the 2008 financial crisis on the Italian economy and labour market, 2004–13
Notes: Panel (a) shows the yearly trend in GDP per capita in purchasing power parity with 2010 as the base year, while panel (b) shows the trend in the unemployment rate. The vertical line indicates the beginning of the financial turmoil in 2007. Source: Istat.
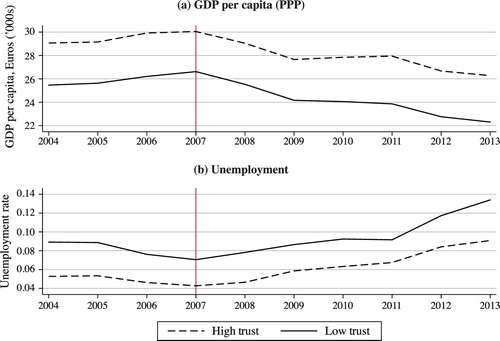
Figure 6 Trends in TFR 2004–13 for two groups of Italian provinces by level of trust
Notes: The comparison is between provinces within the lowest three quartiles of the trust distribution (Low trust, solid line) and those belonging to the highest quartile (High trust, dashed line). Source: As for .
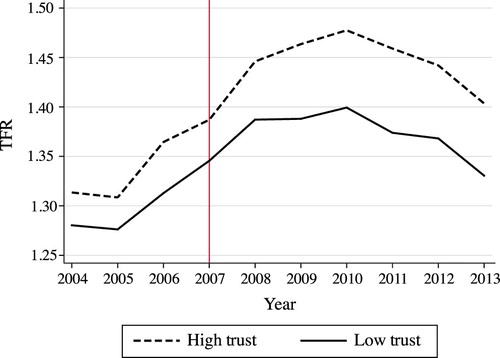
Table 2 Difference-in-Differences estimates for the TFR in Italian provinces 2004–13: baseline results
Figure 7 Difference-in-Differences estimates with leads and lags
Notes: The figure shows the point estimates of the model in and the confidence intervals at 90 per cent (least wide spikes), 95 per cent (medium width spikes), and 99 per cent (widest spikes). The omitted category is the interaction between Trust and the dummy for the year 2007. Source: Authors’ analysis based on the data described in Appendix A1 (in the supplementary material).
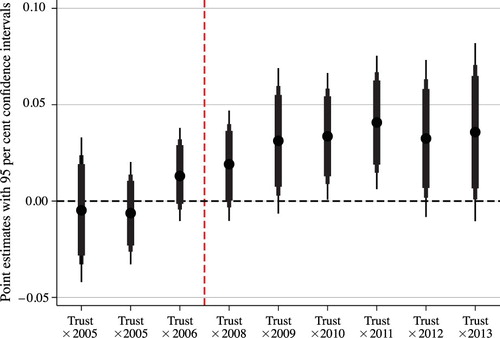
Table 3 Difference-in-Differences estimates for the TFR in Italian provinces 2004–13, with the inclusion of leads and lags
Table 4 Difference-in-Differences estimates for ASFRs in Italian provinces 2004–13
Table 5 Triple Difference-in-Differences estimates for the TFR in Italian provinces 2004–13: the effect of trust for different levels of childcare services
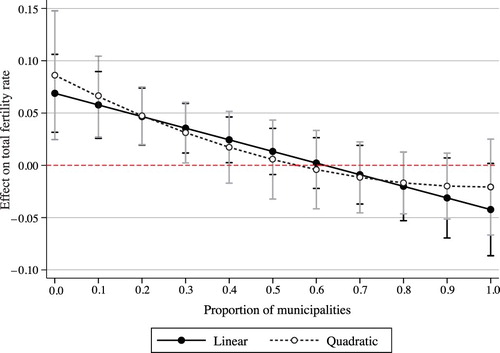
Figure 8 Average marginal effects of trust in post-crisis times
Notes: The figure shows the average linear and quadratic marginal effects on the TFR of being a high trust province by different levels of public childcare provision, together with the 95 per cent confidence intervals. Public childcare provision is measured as the proportion of municipalities providing childcare services within each province. Source: As for .