Figures & data
Figure 1 Reference maps of the EU-27 NUTS-2 regions: (a) NEUJOBS urban–rural classification; inset map shows the division of European countries into Western, Southern, and Eastern parts; mosaic plot in the top left corner gives the relative frequencies of the regions across the three parts of Europe and the Urban/Intermediate/Rural classification. (b) Percentage of the population that is of working age in 2003. (c) Percentage of the population that is of working age in 2013
Notes: See Appendix A for a reference map with all the regions labelled. SD refers to the standard deviation and CV to the coefficient of variance. Source: De Beer et al. Citation2012; Eurostat Citation2015a; Eurovoc Citation2017 (modified by the authors).
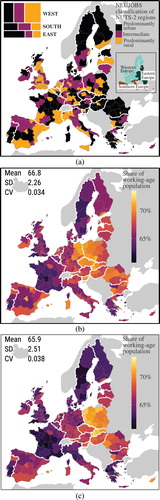
Figure 2 Age-specific total net migration rates per 1,000 population by urban–rural type of NUTS-2 regions, pooled single-year data for the period 2003–12
Note: The lines are smoothed using a generalized additive model. Source: Own calculations based on demographic balance; migration change includes both internal and international migration.
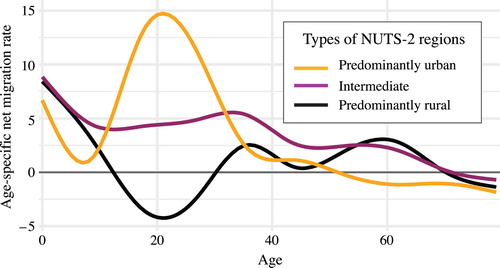
Figure 3 Age-specific total net migration rates per 1,000 population by urban–rural type of NUTS-2 regions and parts of Europe, pooled single-year data for the period 2003–12
Note: The lines are smoothed using a generalized additive model. Source: As for .
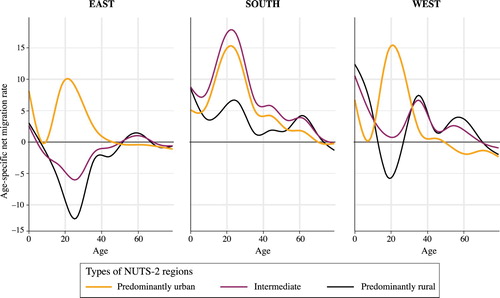
Figure 4 Empirical cumulative densities of the share of working-age population for NUTS-2 regions in the three parts of Europe, 2003, 2008, and 2013
Note: The annotated tables represent the parameters of the cumulative densities estimated by non-linear least squares— and
are the parameters of the logistic curve above and below the median, respectively, and
is the median value of the share of working-age population. Source: Own calculations based on population age structures.
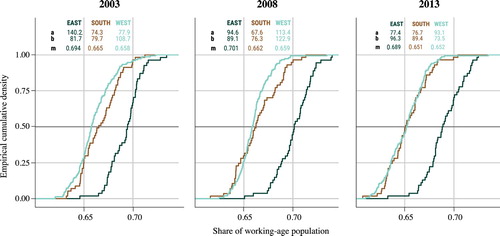
Figure 5 Empirical cumulative densities of the share of working-age population for NUTS-2 regions in the two urban–rural categories, Europe, 2003, 2008, and 2013
Note: The annotated tables represent the parameters of the cumulative densities estimated by non-linear least squares— and
are the parameters of the logistic curve above and below the median, respectively, and
is the median value of the share of working-age population. Source: As for .
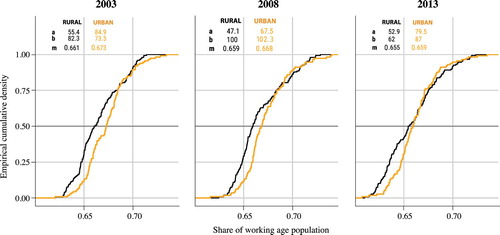
Figure 6 Empirical cumulative densities of the share of working-age population for the NUTS-2 regions in three parts of Europe and two urban–rural categories, 2003, 2008, and 2013
Note: The annotated tables represent the parameters of the cumulative densities estimated by non-linear least squares— and
are the parameters of the logistic curve above and below the median, respectively, and
is the median value of the share of working-age population. Source: As for .
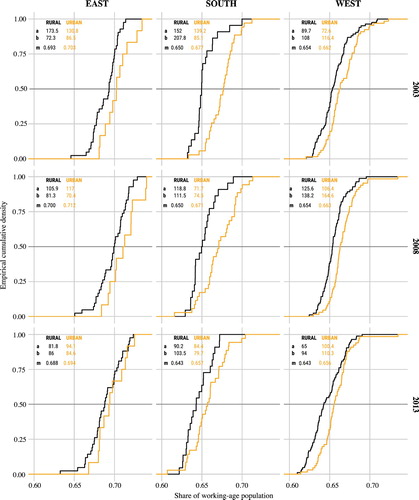
Figure A1 Reference map of the EU-27 NUTS-2 regions
Note: 261 regions; NUTS 2010 version Source: As for .
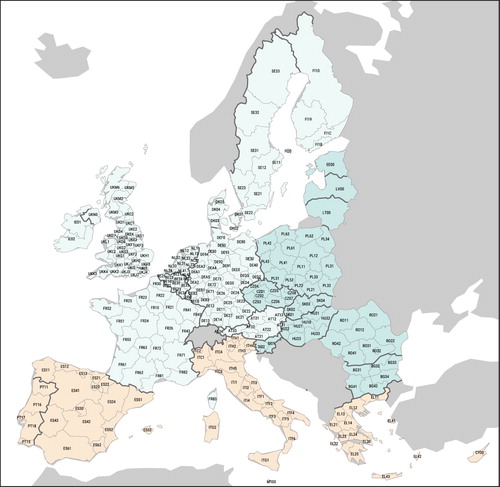
Figure A2 Age-specific total net migration rates per 1,000 population by urban–rural type of NUTS-2 regions: pooled single-year data for two subperiods, 2003–07 and 2008–12
Note: The lines are smoothed using a generalized additive model. Source: As for .
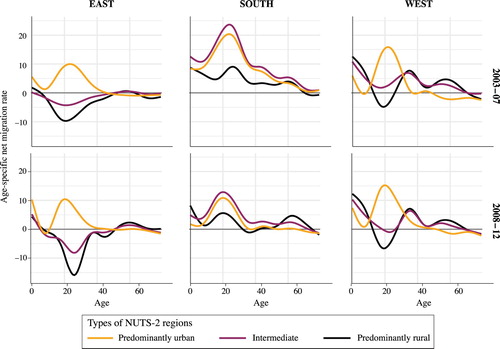
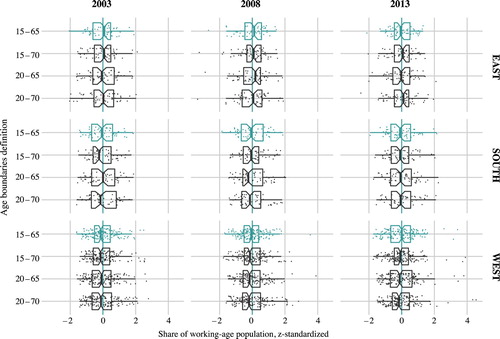
Figure A3 Box plots for the z-standardized shares share of working-age population calculated using the conventional lower and upper age boundaries of 15 and 65 years (green colour or light grey in print) and three alternative definitions—age boundaries of 15–70, 20–65, and 20–70 years (dark grey): NUTS-2 regions in three parts of Europe, 2003, 2008, and 2013
Source: As for .