Figures & data
Figure 1 Immigration to Norway from three origin country groups, 1975–2017
Source: Statistics Norway.
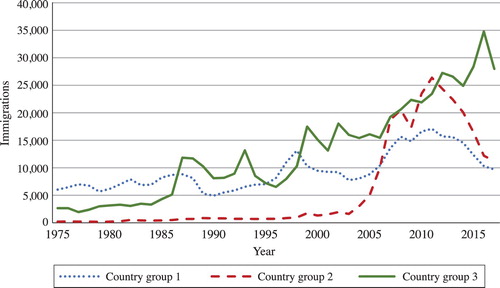
Figure 2 Age profiles of immigrants arriving in Norway by origin country group, 1990–2017
Notes: Thick lines show averages; thin grey lines show single arrival years.Source: Statistics Norway and authors’ calculations.
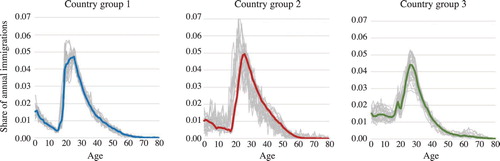
Figure 3 Classification of immigrants’ arrival ages in Norway and average age profiles for immigrants arriving 1990–2017, by origin country group
Source: As for .
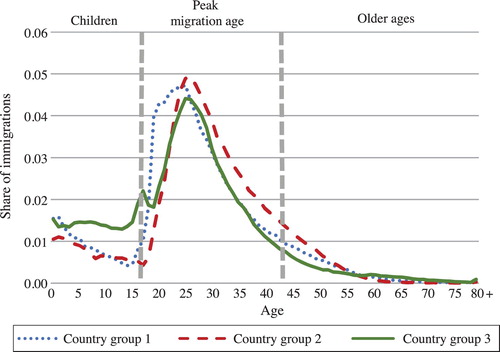
Figure 4 Share of population in different age groups, estimated and projected by the WPP 2019 medium variant, by country group, 1975–2100
Source: World Population Projections and authors’ calculations.
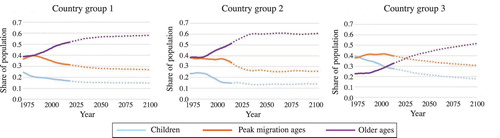
Table 1 Projection methods for emigration rates used in this study
Figure 5 Immigration to Norway from three origin country groups, registered 1990–2017 and projected 2018–2100 by seven different methods, aggregated and disaggregated by age
Notes: The line shadings indicate the seven different methods used. Projections using disaggregated age groups in origin regions are shown by dotted/dashed lines and those with no age disaggregation are shown by solid lines. Source: As for .
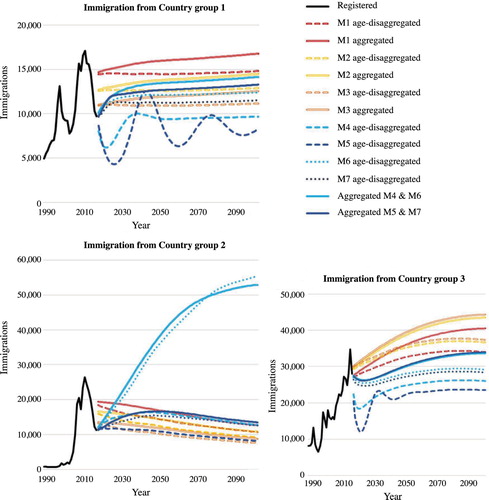
Figure 6 Difference in annual immigration to Norway, 2018–2100, if projection method disaggregates by age (for sum of the three origin country groups)
Source: Authors’ calculations.
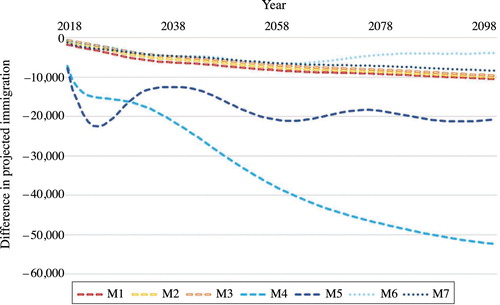
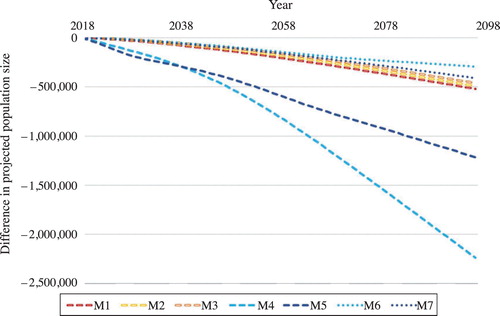
Figure 7 Differences in projected population size in Norway, 2018–2100, caused by introducing age disaggregation into immigration projections
Source: As for .