Figures & data
Figure 1 Distributions of main variables of interest: (a) Fertility intentions; (b) Stability perception; (c) Resilience perception; and (d) Risk attitude
Note: The sample includes employed individuals aged 18–50 who are married or cohabiting and living in Italy. The sample size is N = 521 for panels (a), (b), and (c) and N = 519 for panel (d).
Source: Authors’ calculations from Trustlab 2017 survey data.
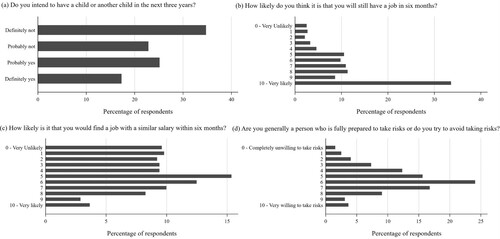
Figure 2 Geographical distribution of area-level variables in Italy in 2017: (a) Unemployment rate; (b) Percentage of fixed-term contracts; (c) Area-level stability perception; and (d) Area-level resilience perception
Notes: The variable in panel (c) is calculated as the average percentage of employed individuals across the four trimesters of the 2017 LFS that answered No to the question Do you think it is likely that you will lose/stop your current job in the next six months? The variable in panel (d) is calculated as the average percentage of employed individuals across the four trimesters of the 2017 LFS that answered Yes to the question Would you find it easy finding/starting a job similar to the one you are currently employed in?
Source: Authors’ calculations from ISTAT LFS data, 2017.
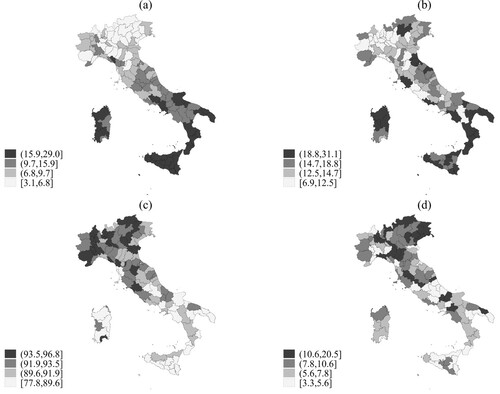
Table 1 Odds ratios for determinants of intending to have a(nother) child in the next three years, ordered logistic regression models: employed individuals aged 18–50 who are married/cohabiting and living in Italy, 2017
Table 2 Average marginal effects of stability and resilience perception on each of the four levels of the dependent variable (fertility intention), through ordered logistic regression: employed individuals aged 18–50 who are married/cohabiting and living in Italy, 2017 (N = 519)
Table 3 Average marginal effects of stability and resilience perception on each of the four levels of the dependent variable (fertility intention), by sex, through ordered logistic regression: employed individuals aged 18–50 who are married/cohabiting and living in Italy, 2017
Table 4 Regressing fertility intentions on resilience perception and stability perception using micro-level variables from Trustlab (model 1) and micro-level variables net of area-level ones (model 2): employed individuals aged 18–50 who are married/cohabiting and living in Italy, 2017
Table 5 Moderation effects of unemployment rate and percentage of fixed-term contracts at the macro-provincial level on the relationship between employment uncertainty and fertility intentions: employed individuals aged 18–50 who are married/cohabiting and living in Italy, 2017
Figure 3 Average marginal effects of (a) stability perception and (b) resilience perception on fertility intentions, by unemployment rate tertile
Notes: The estimation refers to the specification in , model 1, including 519 observations. Charts show point estimates and 90 per cent confidence intervals. The AMEs are calculated on the four levels of the dependent variable (fertility intentions), measured through the question Do you intend to have a child or another child in the next three years?, and answers range from ‘1’ (definitely not) to ‘4’ (definitely yes).
Source: As for .
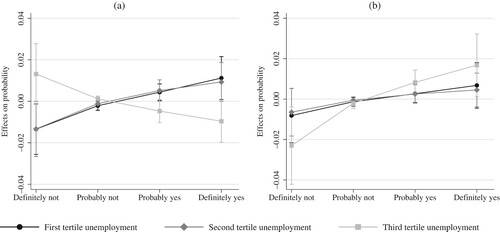
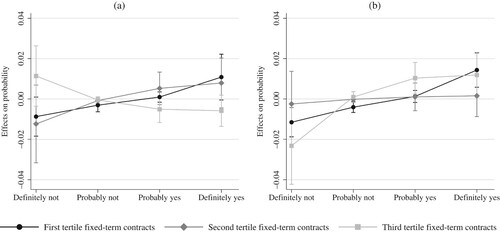
Figure 4 Average marginal effects of (a) stability perception and (b) resilience perception on fertility intentions, by percentage of fixed-term contracts tertile
Notes: The estimation refers to the specification in , model 2, including 519 observations. Charts show point estimates and 90 per cent confidence intervals. The AMEs are calculated on the four levels of the dependent variable (fertility intentions), measured through the question Do you intend to have a child or another child in the next three years?, and answers range from ‘1’ (definitely not) to ‘4’ (definitely yes).
Source: As for .