Figures & data
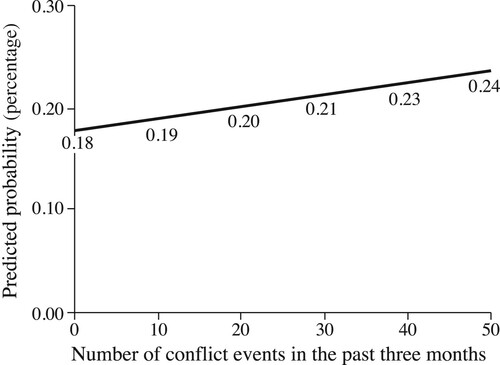
Figure 1 Prevalence of conflict events across Colombia, 1989–2016
Note: Each dot is an event and a bigger size indicates more casualties in that event. Events in 2017 (n = 9) were excluded because they could not be linked to DHS data.
Source: Author’s analysis of UCDP-GED data.
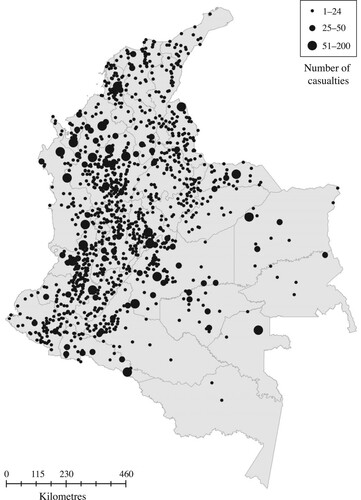
Figure 2 Share of women aged 13–49 who are sterilized and number of conflict events in Colombia, 1991–2016
Note: The solid line shows the proportion of women sterilized (left-hand y-axis); the dashed line shows the number of conflict events (right-hand y-axis). Observation starts in 1991 to allow for a 24-month time lag in exposure to conflict.
Source: Author’s analysis of DHS and UCDP-GED data.
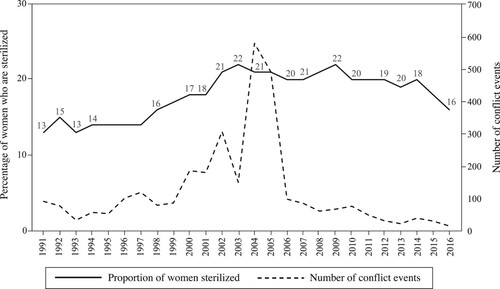
Table 1 Descriptive statistics of sample population: women aged 13–49 in Colombia
Table 2 Summary statistics of women’s exposure to conflict events
Table 3 Department fixed effects linear probability models of women’s uptake of sterilization in relation to armed conflict in Colombia
Figure 3 Predicted probabilities of becoming sterilized according to number of conflict events in the past three months, women aged 13–49 in Colombia, 1991–2016
Note: Observation starts in 1991 to allow for a 24-month time lag in exposure to conflict.
Source: As for .