
Figures & data
Table 1 Partnership state and Internet access, United States, 2003–11 (NLSY97 cohort)
Table 2 Control variables used in analysis of NLSY97 cohort, United States, 2003–11
Figure 1 Predicted probability of being in a partnership by Internet access by year (age) of the NLSY97 cohort, United States
Note: Vertical bars show 95 per cent confidence intervals.
Source: NLSY97 data.
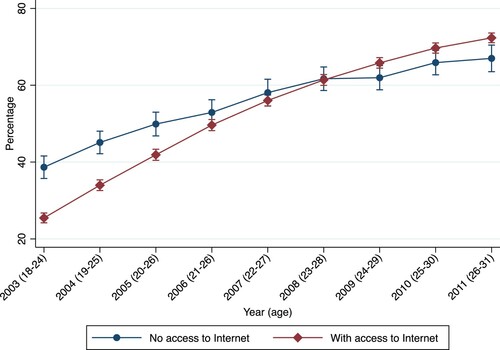
Table 3 Multilevel multinomial logistic regression models of partnership, NLSY97 cohort, United States
Figure 2 Predicted probability of being in a partnership by Internet access and age (CPS), United States, pooled data from 1997 to 2015
Note: Vertical bars show 95 per cent confidence intervals.
Source: CPS data.
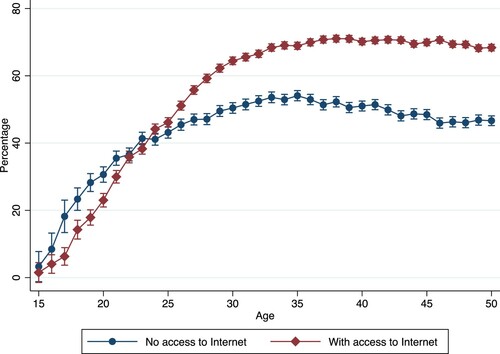
Table 4 Multinomial logistic regression models of partnership, CPS data, United States, 1997–2015