Figures & data
Figure 1 Special cases where the non-overlap index cannot perform well
Source: Authors’ own.
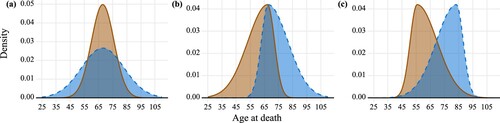
Figure 2 Hypothetical scenarios of age-at-death distributions in two groups
Source: As for .
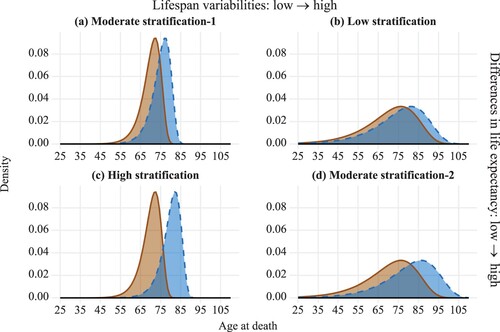
Figure 3 Lifespan distributions for highest and lowest income quintiles by sex: Finland, 1996–2000, 2006–10, and 2013–17
Notes: Dashed lines show the values of mean age at death. S refers to lifespan stratification; Δe25 refers to the difference in life expectancy at age 25; ΔSD refers to the difference in the standard deviations.
Source: Authors’ own calculations based on Finnish registry data.
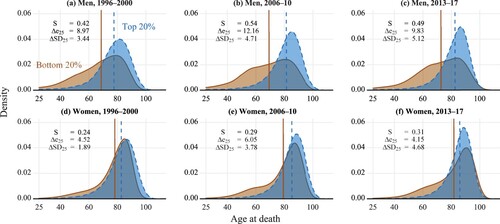
Figure 4 Trends in life expectancy and lifespan variability at age 25, by income quintile and sex: Finland, 1996–2017
Note: e25 refers to life expectancy at age 25; SD25 refers to lifespan variability at age 25, as measured by the standard deviation.
Source: As for .
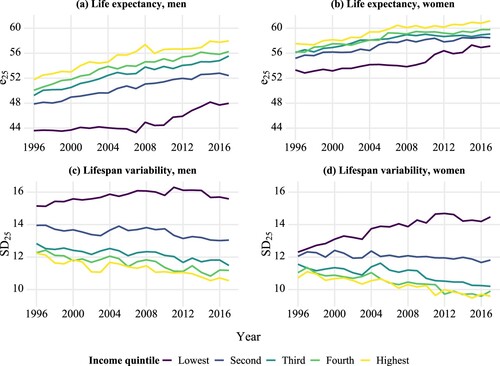
Figure 5 Trends in lifespan stratification and differences in life expectancy and lifespan variability at age 25 between the lowest and highest income quintiles, by sex: Finland, 1996–2017
Note: S refers to lifespan stratification; Δe25 refers to the difference in life expectancy at age 25; ΔSD25 refers to the difference in the standard deviations.
Source: As for .
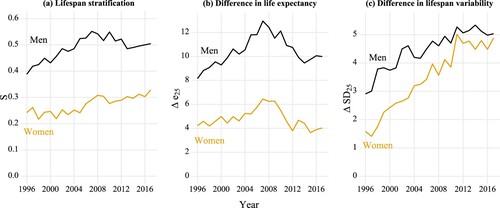
Figure 6 Pairwise associations between lifespan stratification and two other measures—life-expectancy differences and lifespan-variability differences—by sex, Finland, 1996–2017
Notes: Each point refers to a comparison between two income groups (e.g. the lowest and the second lowest income quintile groups, or the third and the highest income quintile groups) in a given year. The colour becomes darker when multiple data points overlap. S refers to lifespan stratification; e25 refers to life expectancy at age 25; SD25 refers to the standard deviation at age 25; Corr. is the Pearson correlation coefficient.
Source: As for .
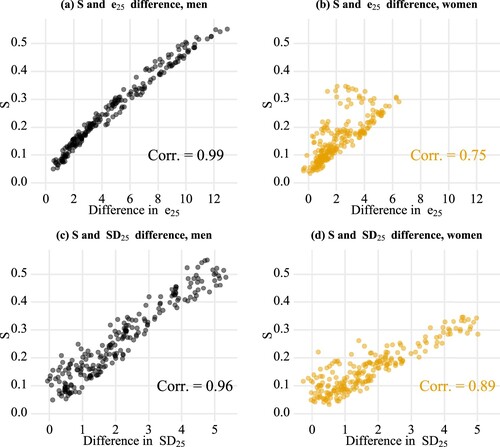
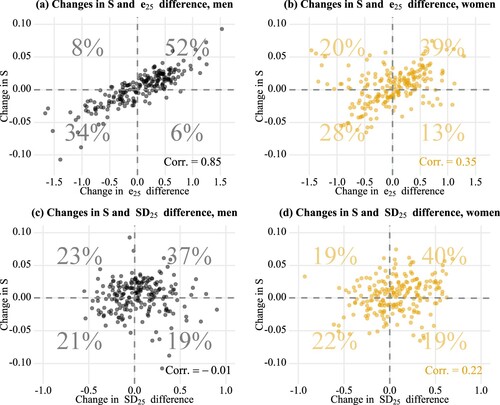
Figure 7 Pairwise associations between year-on-year changes in lifespan stratification and year-on-year changes in two other measures—life-expectancy differences and lifespan-variability differences—by sex, Finland, 1996–2017
Note: Each point refers to a comparison between two income groups (e.g. the lowest and the second lowest income quintile groups, or the third and the highest income quintile groups) in a given year. The colour becomes darker when multiple data points overlap. S refers to lifespan stratification; e25 refers to life expectancy at age 25; SD25 refers to the standard deviation at age 25; Corr. is the Pearson correlation coefficient.
Source: As for .