Figures & data
Figure 1 Differences in GPA at age 16 by gestational age at birth: results from sibling comparisons for individuals born in Sweden in 1982–94
Notes: The figure shows the relationship between categories of gestational age at birth and grade point average (GPA) scores as measured by the coefficients from sibling models adjusting for: (i) maternal age and child characteristics (OLS); and (ii) maternal age and child characteristics, as well as shared family-specific factors (fixed effects). Children born at full term are the reference category in the models. Vertical lines show 95 per cent confidence intervals. Full results are presented in Table A4, supplementary material.
Source: Swedish register data, 1982–94 birth cohorts.
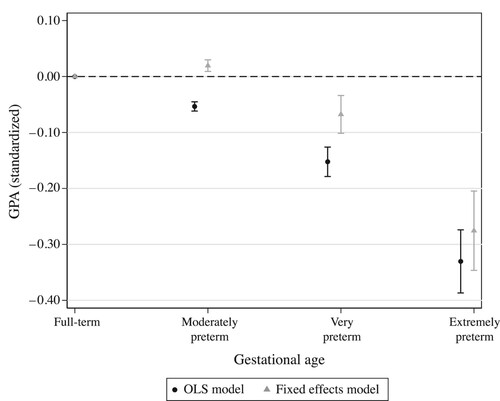
Figure 2 Differences in GPA at age 16 by gestational age at birth and parental SES: results from sibling comparisons for individuals born in Sweden in 1986–92
Notes: The figure shows the relationship between categories of gestational age at birth and grade point average scores (GPA) as measured by the coefficients from sibling models adjusting for maternal age and child characteristics and shared family-specific factors. Vertical lines show 95 per cent confidence intervals. For parental income quintiles, ‘1’ represents the lowest income and ‘5’ the highest. Full results are presented in Table A5, supplementary material.
Source: Swedish register data, 1986–92 birth cohorts.
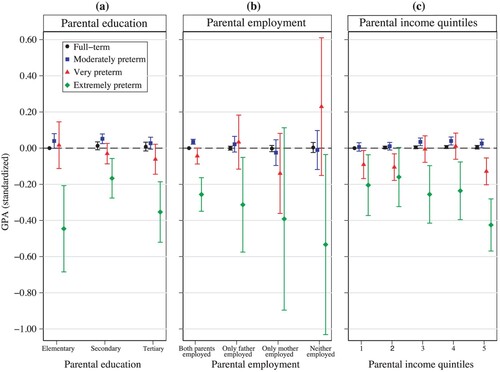
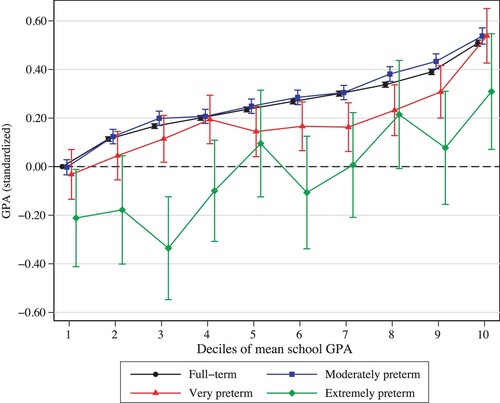
Figure 3 Differences in GPA at age 16 by gestational age at birth and mean school district GPA: results from sibling comparisons for individuals born in Sweden in 1986–92
Notes: The figure shows the relationship between categories of gestational age at birth and grade point average scores (GPA) as measured by the coefficients from sibling models adjusting for maternal age and child characteristics and shared family-specific factors. Vertical lines show 95 per cent confidence intervals. For mean school GPA deciles, ‘1’ represents the lowest grade and ‘10’ the highest. Full results are presented in Table A7, supplementary material.
Source: As for .